MILESTONE 🌟 5 Million+ creative minds trust SlideEgg! Grab 80% OFF

Effective Chart PowerPoint And Google Slides Template

Pack of 15 slides
P.ID : 9187
Advertisement
501 views
38 Downloads
Get Custom Slides by Experts
Enhance Your Presentations with Add-ins
Google Slides Add-in
Access templates directly in Google Slides
Microsoft PowerPoint Add-in
Access templates directly in PowerPoint
GPT Add-on
AI-powered presentation assistance

Chart PowerPoint, Google Slides, and Canva Template


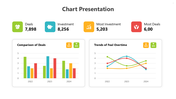
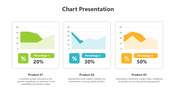
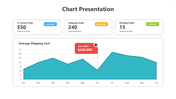
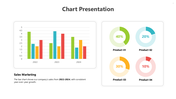
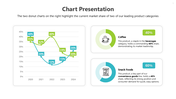
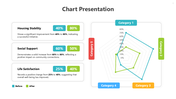
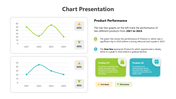
Visualize your data with clarity and style using the Chart PPT Template. Featuring a vibrant multicolor theme and dynamic shapes, this template is designed to make your charts, graphs, and infographics easy to understand, visually appealing, and engaging. Perfect for professionals, educators, and students, it helps you present complex data in a simple, impactful, and memorable way.

Ideal for business analysts, marketers, teachers, researchers, and students, this template makes it easy to showcase reports, trends, and insights with professional, eye-catching visuals.

Transform your data into clear, impactful visuals! Download the Chart PPT Template now and make your presentations unforgettable.


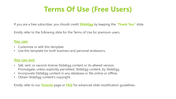
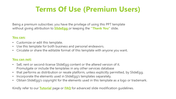
Features of the template

  • 100% customizable slides and easy to download.
  • Slides are available in different nodes & colors.
  • The slide contains 16:9 and 4:3 formats.
  • It is easy to change the colors of the slide quickly. 
  • Well-crafted template with an instant download facility.


You May Also Like These PowerPoint Templates

Add to Wishlist
Download
AI Customize
Dark themed layout featuring four pie charts with shaded segments, each displaying different percentages.
Add to Wishlist
Download
AI Customize
Stacked traction bar graph with red, blue, green, orange bars labeled with percentage values and caption areas.
Add to Wishlist
Download
AI Customize
Cash flow dashboard with a vertical bar chart and two horizontal stacked bar charts detailing revenue categories.
Add to Wishlist
Download
AI Customize
Green shaded bar chart displaying data from 2016 to 2021, with three numbered captions below.
Add to Wishlist
Download
AI Customize
Chart slide showing market supply data from 2004 to 2014 with red bars and percentage annotations.
Add to Wishlist
Download
AI Customize
Dashboard with four bar charts in yellow, green, teal, and red, comparing project risks and change requests.
Add to Wishlist
Download
AI Customize
Project Gantt chart with task descriptions, percentage completion, and horizontal progress bars.
Add to Wishlist
Download
AI Customize
Three circular dashboard dials with red, blue, and brown segments, each containing captions below.
Add to Wishlist
Download
AI Customize
Slide featuring a dashboard with three dials labeled Low, Mid, and High, indicating various levels of measurement.
Add to Wishlist
Download
AI Customize
Slide with pie charts, line graphs, and a bar chart in shades of green, illustrating data trends and comparisons.
Free
Add to Wishlist
Download
AI Customize
PowerPoint slide showcasing projected cash flows, NPV for 3 and 5 years, and payback period with client testimonial.
Add to Wishlist
Download
AI Customize
Six month Gantt chart with bars in blue, green, red, orange, and teal, arranged for task tracking.
Free
Add to Wishlist
Download
AI Customize
Infographic of a bar chart representing yearly growth from 2018 to 2021 with a businesswoman illustration.
Add to Wishlist
Download
AI Customize
Slide with a multi colored cone shape divided into four layers labeled A, B, C, and D for different text sections.
Free
Add to Wishlist
Download
AI Customize
Slide featuring five colorful cones and placeholder text areas for each.
Free
Add to Wishlist
Download
AI Customize
Three inverted cone shapes in green, purple, and blue, each with an icon and corresponding placeholder text beneath.
Add to Wishlist
Download
AI Customize
Cone of experience slide with a colorful funnel design, featuring layered sections in different colors and text areas.
Add to Wishlist
Download
AI Customize
Colorful cone diagram with five sections in different colors  each paired with a letter on the left and caption area.
Add to Wishlist
Download
AI Customize
Colorful layered cone shapes in red, blue, green, yellow, and orange, arranged vertically with captions.
Add to Wishlist
Download
AI Customize
Cone PPT template with three colorful layered cones of varying sizes labeled with percentages and text areas.
Free
Add to Wishlist
Download
AI Customize
Three vertical cone graphics in purple, maroon, and red with text areas below, set against a white background.
Free
Add to Wishlist
Download
AI Customize
Cone shaped diagram with six layers in gradient colors, each split into two symmetrical segments, with text placeholders.
Free
Add to Wishlist
Download
AI Customize
Two 3D cones in purple and red, with percentages above, positioned side by side with a central horizontal arrow.
Add to Wishlist
Download
AI Customize
PowerPoint slide with a 3D cone design, displaying text sections on all four sides.
Add to Wishlist
Download
AI Customize
Five layer cone model with colorful horizontal sections labeled 01 to 05 in orange, blue, red, green, and purple.
Add to Wishlist
Download
AI Customize
Slide deck showcasing cone-shaped infographic designs in various layouts and colors for data visualization.
Add to Wishlist
Download
AI Customize
Cone shaped infographic divided into red and orange triangular segments with various technology icons.
Add to Wishlist
Download
AI Customize
PowerPoint slide with a colorful cone design, featuring five sections, each with placeholder text on a white backdrop.
Add to Wishlist
Download
AI Customize
3D funnel diagram with six colorful sections in purple, red, green, orange, blue, and pink, linked to text boxes.
Free
Add to Wishlist
Download
AI Customize
A slide with a three-tier cone design, featuring labeled sections and icons for each layer.
Free
Add to Wishlist
Download
AI Customize
Interesting Template Presenacone Cone PPT Slides
Free
Add to Wishlist
Download
AI Customize
Funnel shaped diagram with six colorful 3D rings in red, pink, orange, purple, blue, and yellow, aligned with text boxes.