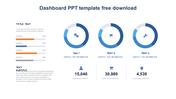
Easy To Customize Charts PowerPoint And Google Slides

Slide with multiple charts including bar, line, and pie charts illustrating data for hires, turnover, and training.
P.ID : 9040
    722 views
    119 Downloads
    Get Custom Slides by Experts
    Instantly Access Templates in PowerPoint

    Charts PowerPoint Template


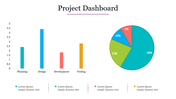
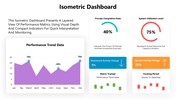
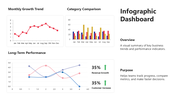
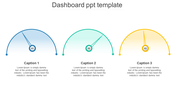
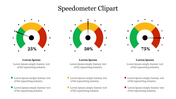
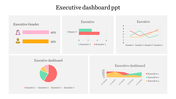
    In the world of visual communication, a chart emerges as a dynamic tool, skillfully condensing complex data into a clear and accessible format. Imagine a PowerPoint template that seamlessly incorporates versatile charts to elevate your presentations. This multicolor-themed template not only adds vibrancy but also caters to a spectrum of users, from analysts to educators. Every slide is fully editable, allowing users to customize content effortlessly. Ideal for professionals seeking impactful data visualization, this template aids in conveying information with precision and flair. Whether you're a business analyst illustrating trends or an educator simplifying concepts, this template ensures an engaging and informative experience. Utilize this tool to streamline your presentations, captivate your audience, and transform data into a compelling visual narrative, setting the stage for effective communication and understanding.


    Features of this template


    • 100% customizable slides and easy to download.
    • The slide contained 16:9 and 4:3 formats.
    • Easy to change the slide colors quickly.
    • It is a well-crafted template with an instant download facility.
    • Highly compatible with PowerPoint and Google Slides.
    Advertisement

    You May Also Like These PowerPoint Templates

    Add to Wishlist
    Download
    AI Customize
    Vector illustration of a speedometer with colored section on a conveyor belt with placeholder text.
    Add to Wishlist
    Download
    AI Customize
    Timeline chart template showing tasks across four years with segmented bars in yellow, red, and purple.
    Add to Wishlist
    Download
    AI Customize
    PowerPoint slide featuring four bar charts with different colors and captions, each representing different data percentages.
    Add to Wishlist
    Download
    AI Customize
    Scatter plot with differently sized bubbles in orange and purple, with a legend and product descriptions to the side.
    Add to Wishlist
    Download
    AI Customize
    Green color KWL chart presentation template with sections for What I Know, What I Want to Know, and What I Learned.
    Add to Wishlist
    Download
    AI Customize
    Yearly loss chart with six green bars and a line graph illustrating trends from 2014 to 2019.
    Add to Wishlist
    Download
    AI Customize
    Mekko chart displaying monthly data in sections, with colors indicating different categories from January to December.
    Add to Wishlist
    Download
    AI Customize
    KWL chart slide with three light gray boxes, featuring maroon headers and side labels for knowledge tracking.
    Add to Wishlist
    Download
    AI Customize
    3D bar chart with four vertical bars in blue, teal, purple, and yellow, with percentage labels and captions for each.
    Add to Wishlist
    Download
    AI Customize
    Slide with three charts, each having four bars in green, pink, yellow, and blue, with text below.
    Add to Wishlist
    Download
    AI Customize
    KWL Chart Infographics PPT Template For Presentation
    Free
    Add to Wishlist
    Download
    AI Customize
    Slide with a circular chart and two bars, highlighted in red, with progress indicator and explanatory text beside.
    Add to Wishlist
    Download
    AI Customize
    Pie chart on the left with four colored sections and percentages, alongside steps with matching colors on the right.
    Add to Wishlist
    Download
    AI Customize
    PowerPoint slide with multiple charts and graphs, including a line chart, bar chart, and area chart, each with captions.
    Add to Wishlist
    Download
    AI Customize
    PPT slide with a line chart illustrating trends for three series, using red, blue, and yellow lines with a caption.
    Add to Wishlist
    Download
    AI Customize
    Technology slide featuring a line graph with data points and percentages, set against a grayscale geometric pattern.
    Add to Wishlist
    Download
    AI Customize
    Project Gantt chart PPT slide showing project tasks, progress percentages, and timelines for November and December 2020.