Attractive Executive Dashboard PPT With Chart Diagram

Infographic featuring pie graph, horizontal and vertical bar charts for visualizing data trends and comparisons.
P.ID : 3798
    840 views
    83 Downloads
    Get Custom Slides by Experts
    Instantly Access Templates in PowerPoint

    Colorful Executive Dashboard PPT With Chart Diagram


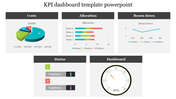
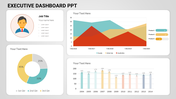
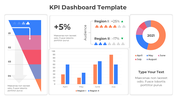
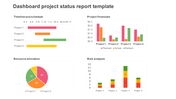
    Get the overall view with a crystal-clear performance of your business house by using this executive dashboard PPT template

    Slide Design: 

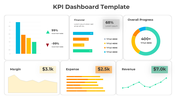
    Three data visualization charts represent key metrics—one pie, one bar, and one column chart—all in an easy format to digest. The template is oriented toward progress tracking, identifying trends, and making data-driven decisions.

    Who can use this template?

    This template will be useful for all those facing the task of communicating complex business data in the clearest, most concise, and yet most visually appealing way possible. These users include:
    1. Business CEOs or leaders who report to investors or boards of directors
    2. Managers charged with updating their teams about performance results
    3. Marketing teams for tracking campaign results

    How this template works?

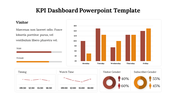
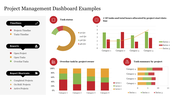
    This template hosts a junction of three different chart types, able to serve a wide variety of data effectively. That versatility will have you tailoring your dashboard toward what best describes the most important metrics for your audience.

    Download now

    Features of the template


    • 100% customizable slides and easy to download.
    • The slides contain 16:9 and 4:3 formats.
    • Easy to change the colors quickly.
    • It is a well-crafted template with an instant download facility.
    • It is a 100% pre-designed slide.
    • The slide holds vibrant colors.
    Advertisement

    You May Also Like These PowerPoint Templates

    Add to Wishlist
    Download
    AI Customize
    Slide with a vertical bar chart and four labeled sections, each paired with a unique color and icon.
    Add to Wishlist
    Download
    AI Customize
    Dashboard-themed slide with semi-circle charts for business analysis, featuring metrics and reflective silhouettes at the bottom.
    Add to Wishlist
    Download
    AI Customize
    Bar chart infographic with four blue bars for kpi forecasts, a line graph overlay, and a man with a magnifying glass.
    Add to Wishlist
    Download
    AI Customize
    Executive dashboard slide featuring bar graphs and pie charts comparing project data over three years, with text boxes.
    Add to Wishlist
    Download
    AI Customize
    Four colored circular progress, one is higlighted in a box with a pie chart, and a bar chart labelled with sections.
    Add to Wishlist
    Download
    AI Customize
    Key performance indicator slide displaying data bars, percentages, and distinct icons in a structured layout.
    Add to Wishlist
    Download
    AI Customize
    Comprehensive program dashboard featuring charts and gauges for quality, budget, risks, overall project map, progress, and resource updates.
    Free
    Add to Wishlist
    Download
    AI Customize
    Four black speedometers with white numbers and yellow markers arranged in a two by two grid with descriptions.
    Free
    Add to Wishlist
    Download
    AI Customize
    A blue themed slide featuring a multi year bar chart comparison from 2016 to 2021 with three placeholders below.
    Free
    Add to Wishlist
    Download
    AI Customize
    3D chart with five colored bars in gold, red, green, teal, and orange, on individual bases, displaying percentages above.
    Free
    Add to Wishlist
    Download
    AI Customize
    Five step process chart with titled segments in shades of purple, showing stages and supporting information.
    Add to Wishlist
    Download
    AI Customize
    Innovative KWL Chart PowerPoint Presentation Slide
    Add to Wishlist
    Download
    AI Customize
    Analysis report template featuring a purple and green area graph comparing five projects, with separate information
    Add to Wishlist
    Download
    AI Customize
    Area chart with overlapping blue, teal, and green sections, timeline on the axis, and three labeled boxes below.
    Add to Wishlist
    Download
    AI Customize
    A PowerPoint template displaying growth with stages represented by numbered circles showing data for different stages.
    Add to Wishlist
    Download
    AI Customize
    Color coded KWL chart template with sections for What I Know, What I Want to Know, and What I Learned with placeholder text.
    Add to Wishlist
    Download
    AI Customize
    Pie chart slide showcasing six labeled segments in yellow and gray with surrounding icons, on a blue networked background.