Use Dashboard PPT Presentation and Google Slides Template

Dashboard slide featuring three colorful pie charts in the top row and a line graph below showing monthly data trends.
P.ID : 31526
    547 views
    46 Downloads
    Get Custom Slides by Experts
    Instantly Access Templates in PowerPoint

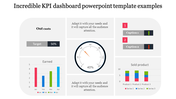
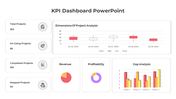
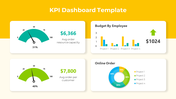
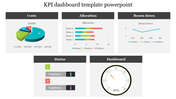
    Dashboard PowerPoint Template


    Dashboards are essential tools for navigating the complexities of data analysis in today's fast-paced world. They offer a centralized platform where users can access critical insights and key metrics at a glance, enabling informed decision-making and streamlined data management.A well-designed dashboard distills complex data sets into easy-to-understand visualizations, empowering users to quickly identify trends, pinpoint opportunities, and address challenges with confidence. Whether you're monitoring sales performance, tracking project milestones, or analyzing website traffic,a dashboard provides a comprehensive overview of your data landscape.Our professionally crafted dashboard template is designed to elevate your data analysis experience. With intuitive layouts, interactive features, and customizable options, our template allows you to harness the power of data visualization effortlessly. Empower yourself and your team to make smarter decisions and drive business success.Download our dashboard template today and unlock the full potential of your data. Take the first step towards enhanced data management and informed decision-making. Don't miss out – download now and transform your data into actionable insights!

    Features of this template


    • 100% customizable slides and easy to download.
    • Slides are available in different nodes & colors.
    • The slide contains 16:9 and 4:3 formats.
    • Easy to change the colors of the slide quickly.
    • Highly compatible with PowerPoint and Google Slides.
    • Well-crafted template with an instant download facility.
    Advertisement

    You May Also Like These PowerPoint Templates

    Add to Wishlist
    Download
    AI Customize
    Mekko chart displaying monthly data in sections, with colors indicating different categories from January to December.
    Add to Wishlist
    Download
    AI Customize
    KWL chart slide with three light gray boxes, featuring maroon headers and side labels for knowledge tracking.
    Add to Wishlist
    Download
    AI Customize
    3D bar chart with four vertical bars in blue, teal, purple, and yellow, with percentage labels and captions for each.
    Add to Wishlist
    Download
    AI Customize
    Slide with three charts, each having four bars in green, pink, yellow, and blue, with text below.
    Add to Wishlist
    Download
    AI Customize
    KWL Chart Infographics PPT Template For Presentation
    Free
    Add to Wishlist
    Download
    AI Customize
    Slide with a circular chart and two bars, highlighted in red, with progress indicator and explanatory text beside.
    Add to Wishlist
    Download
    AI Customize
    Pie chart on the left with four colored sections and percentages, alongside steps with matching colors on the right.
    Add to Wishlist
    Download
    AI Customize
    PowerPoint slide with multiple charts and graphs, including a line chart, bar chart, and area chart, each with captions.
    Add to Wishlist
    Download
    AI Customize
    PPT slide with a line chart illustrating trends for three series, using red, blue, and yellow lines with a caption.
    Add to Wishlist
    Download
    AI Customize
    Technology slide featuring a line graph with data points and percentages, set against a grayscale geometric pattern.
    Add to Wishlist
    Download
    AI Customize
    Project Gantt chart PPT slide showing project tasks, progress percentages, and timelines for November and December 2020.
    Add to Wishlist
    Download
    AI Customize
    Two brown 3D pie charts side by side, showing company growth and achievement with segmented sections.
    Add to Wishlist
    Download
    AI Customize
    Chart slide featuring a weekly schedule with multiple rows and columns with placeholder text gradient blue and green bars.
    Add to Wishlist
    Download
    AI Customize
    Editable PowerPoint Chart Templates For Presentation
    Add to Wishlist
    Download
    AI Customize
    Infographic with bar charts, percentage stats, and a layered blue 3D smartphone like structure with four captions.
    Free
    Add to Wishlist
    Download
    AI Customize
    Line chart with green and yellow lines showing three data series, text placeholders and a starburst badge.
    Add to Wishlist
    Download
    AI Customize
    Slide featuring two line graphs and bar charts in green, comparing data across months and quarters.