Chart PowerPoint Template & Google Slides

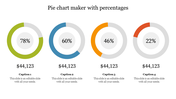
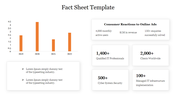
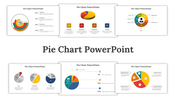
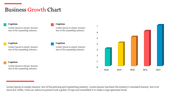
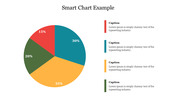
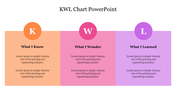

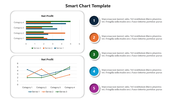
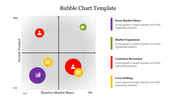
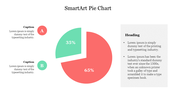

Chart PowerPoint Template & Google Slides
The "Chart PowerPoint Template & Google Slides" provides a versatile tool for visualizing data through bar graphs. This particular template showcases a bar graph illustrating the financial performance of a company over five years. The x-axis denotes the years, while the y-axis represents the corresponding revenue or earnings in millions. Users have the flexibility to modify the years and text labels to suit their specific data sets.
This template is suitable for a wide range of users, including business professionals, analysts, educators, and students, who may need to present data-driven insights, financial reports, market trends, or performance metrics. Whether delivering quarterly earnings updates, sharing market research findings, or teaching data analysis concepts.
Compatibility with PowerPoint and Google Slides. Available in 16:9 and 4:3 aspect ratios, catering to different screen sizes and presentation preferences. Provided in ZIP format for easy sharing and distribution. Free template with 100% customizable features. Download now


You May Also Like These PowerPoint Templates
Add to Wishlist
Download
Edit

Add to Wishlist
Download
Edit


Add to Wishlist
Download
Edit

Add to Wishlist
Download
Edit

Add to Wishlist
Download
Edit

Add to Wishlist
Download
Edit


Add to Wishlist
Download
Edit


Add to Wishlist
Download
Edit

Add to Wishlist
Download
Edit

Add to Wishlist
Download
Edit

Add to Wishlist
Download
Edit

Add to Wishlist
Download
Edit

Add to Wishlist
Download
Edit

Add to Wishlist
Download
Edit

Add to Wishlist
Download
Edit

Add to Wishlist
Download
Edit

Add to Wishlist
Download
Edit
