Download Charts For PowerPoint PPT Presentation Slide

Chart layout with stacked bar graphs in red, yellow, green, and teal representing A1 to A8, with captions above.
P.ID : 63252
    512 views
    92 Downloads
    Get Custom Slides by Experts
    Instantly Access Templates in PowerPoint

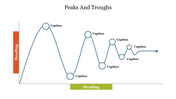
    Creative Presentation Template with Chart model

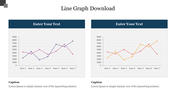
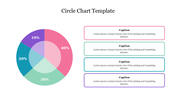
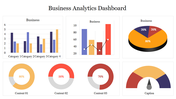
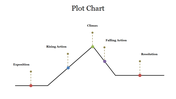
    Get our Download Charts For PowerPoint Template to provide a clear picture of your process in the shape of a chart. It is not so hard to make better Charts if you use our template. You will also learn some PowerPoint tips while using our template. In addition, This Charts template is used to showcase your different processes in a business meeting. Download Charts For PowerPoint Template provides a chart with four captions. Every part of the chart is highlighted with different shades and letters. We have a collection of templates for the chart PowerPoint Templates. Users can change the fonts, the format of this template, and the borders.

    Features of this template

    • 100% Customizable (shape color, size & text)
    • This template has a chart theme
    • Drag and drop image placeholder
    • Huge Collections of chart slides to impress your audience
    • This slide support aspect ratio of 4:3 and 16:9 format
    • Easy to change the slide colors quickly.
    Advertisement

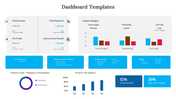
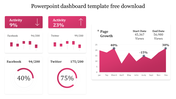
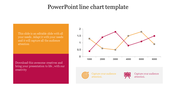
    You May Also Like These PowerPoint Templates

    Add to Wishlist
    Download
    AI Customize
    Chart guide slide with two green-tone line graphs displaying data points, captions on the right, and a text footer.
    Free
    Add to Wishlist
    Download
    AI Customize
    Pie chart illustration showcasing five data segments in varying colors with percentage labels and connected captions areas.
    Add to Wishlist
    Download
    AI Customize
    Vertical Microsoft infographic with four colored arrows each labeled with icons for business, target, analytics, and money.
    Add to Wishlist
    Download
    AI Customize
    Steps to growth slide featuring a chart with four arrows indicating yearly growth percentages and a large text section.
    Add to Wishlist
    Download
    AI Customize
    Bar chart in four distinct bars in multi colour each showing data points with corresponding labels, values and caption areas.
    Add to Wishlist
    Download
    AI Customize
    Chart PowerPoint slide with bar graph and four icons representing data, calendar, and people with placeholder text.
    Add to Wishlist
    Download
    AI Customize
    KPI slide showcasing cash flow metrics and financial performance over six months in different bar chat layouts.
    Free
    Add to Wishlist
    Download
    AI Customize
    Comparison bar chart showing percentage values from 2011 to 2019 for chat and security categories.
    Add to Wishlist
    Download
    AI Customize
    3D bar graph slide displaying data trends across five years, with color coded bars representing values with placeholder text.
    Add to Wishlist
    Download
    AI Customize
    Colorful bar graph illustrating monthly data with values for each month from january to december.
    Add to Wishlist
    Download
    AI Customize
    Slide with a businessman holding a megaphone projecting speech bubble displaying communication icons, and bar charts below.
    Free
    Add to Wishlist
    Download
    AI Customize
    Three separate bar charts in red tones, each section labeled with a percentage and caption.
    Free
    Add to Wishlist
    Download
    AI Customize
    Technology themed slide with five horizontal purple bars showing percentages, icons, and descriptive captions.
    Add to Wishlist
    Download
    AI Customize
    Three charts with orange bars displayed against dark backgrounds, each labeled with categories and series.
    Add to Wishlist
    Download
    AI Customize
    Progress bar template showing Process A and B side by side, with four stages and completion percentages.
    Add to Wishlist
    Download
    AI Customize
    Presentation slide featuring multicolored bar graphs for categories and a purple and gray pie chart with text sections below.
    Add to Wishlist
    Download
    AI Customize
    Graph with teal and gray bars for project budget, along with expenditure icons and amounts displayed on the right.
    Add to Wishlist
    Download
    AI Customize
    Innovative 3D Progress Bar PowerPoint And Google Slides
    Add to Wishlist
    Download
    AI Customize
    Bar chart with two sections in orange and green, with captions and numerical values under each.