Three Node Boat Bar Chart Presentation Template Slide

Illustration of a chart with yellow, red, and green horizontal bars displaying percentages and paper boat icons on waves.
P.ID : 55176
    437 views
    62 Downloads
    Get Custom Slides by Experts
    Instantly Access Templates in PowerPoint

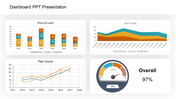
    Excellent Boat Bar Chart PowerPoint Slides Presentation


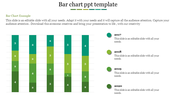
    Discover these Three Node Boat Bar Chart Presentation Template Slides to enhance your ideas appealingly. This template will make a good account of yourself among the audiences. In addition, you can edit and customize the slide to any graphical theme of the presentation.

    About the Template:


    Astonishing Boat Bar Chart Presentation Template Slide will create something that will look professional and make your presentation easy to follow. For example, using this slide, you can explain your business reach over a wide range. You can also use this boat chart to explain your statistical ideas in any field. The yellow, green, and red waves will highlight relevant points of the topic being discussed in the meeting. The fantastic background will be apt in effectively explaining your ideas.

    Features of the Template:

    • Innovative slide background designs
    • 100% easy to edit and customize slides
    • The slide contained 16:9 and 4:3 format.
    • Easy to change the slide colors quickly.
    • The elegant look of this template will give life to your presentation.
    • Crisp and clear font styles.
    • Fantastic slide template.
    Advertisement

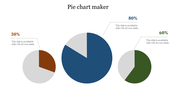
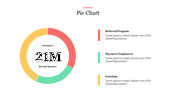
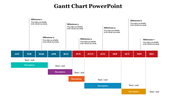
    You May Also Like These PowerPoint Templates

    Free
    Add to Wishlist
    Download
    AI Customize
    Bar chart with five vertical bars representing data analysis with various high, low, and volume indicators displayed.
    Free
    Add to Wishlist
    Download
    AI Customize
    Colorful bar chart with three data categories and corresponding bars each with caption areas.
    Add to Wishlist
    Download
    AI Customize
    Colorful bar graph illustrating monthly data with values for each month from january to december.
    Add to Wishlist
    Download
    AI Customize
    Slide with a businessman holding a megaphone projecting speech bubble displaying communication icons, and bar charts below.
    Add to Wishlist
    Download
    AI Customize
    Three pie charts with segmented sections and percentage labels, each chart featuring placeholder text below.
    Add to Wishlist
    Download
    AI Customize
    A pie chart template with three circular charts representing each with text and icons beside them.
    Add to Wishlist
    Download
    AI Customize
    Area chart with a teal base and five markers in yellow, red, and maroon shades representing growth percentages.
    Add to Wishlist
    Download
    AI Customize
    Pie Chart PowerPoint with Segmented Circles Slides
    Add to Wishlist
    Download
    AI Customize
    Four segmented doughnut charts in yellow, red, purple, and blue with black circular labels, percentage values, and captions.
    Add to Wishlist
    Download
    AI Customize
    Illustration of a chart with yellow, red, and green horizontal bars displaying percentages and paper boat icons on waves.
    Add to Wishlist
    Download
    AI Customize
    A vertical green color bar chart slide displaying loss data from 2014 to 2019, with the title at the top.
    Add to Wishlist
    Download
    AI Customize
    A colorful pie chart diagram with concentric circles showing percentages for different data categories in 2021.
    Free
    Add to Wishlist
    Download
    AI Customize
    Map-based analysis design with statistical data visuals including circular graphs and demographic distributions.
    Free
    Add to Wishlist
    Download
    AI Customize
    Gantt chart slide showing six tasks with progress bars, each reflecting completion levels ranging from 30% to 80%.
    Free
    Add to Wishlist
    Download
    AI Customize
    Three separate bar charts in red tones, each section labeled with a percentage and caption.
    Add to Wishlist
    Download
    AI Customize
    Four orange pie charts with center numbers from 01 to 04, each with text placeholders on the right.
    Add to Wishlist
    Download
    AI Customize
    Microsoft PowerPoint slide featuring three donut charts in yellow, orange, and pink, each with different percentage values.