Awesome Chart Presentation Templates Slide Designs- Bar Chart Model

 Canva
Canva
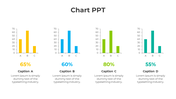
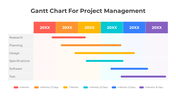
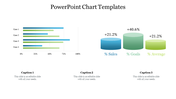
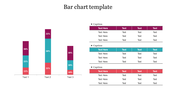
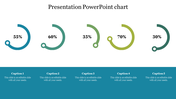
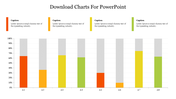

Chart Presentation Template
In today’s data-driven world, presenting information clearly and effectively is key to making informed decisions. Our Chart PPT Templates are designed to transform your data into compelling visual stories, keeping your audience engaged and focused on your message.
Slide Description:
Our slide features a horizontal bar chart. There are four categories labeled from ‘Category 1’ to ‘Category 4’. Each category has two pairs of bars in different shades of blue and orange. The numerical values associated with each category range from 1.8 to 4.5 for the blue bars and from 2.4 to 28 for the orange bars.
Purpose of this slide:
It’s ideal for presentations that require data comparison or trend analysis across different categories.
Who can benefit?
Whether you’re a business professional, educator, or student, this template simplifies creating engaging presentations with clear data visuals.
How can users benefit from this template?
Time-Saving: By using this pre-designed template, users save time on design and formatting. Professional Look: The template ensures a polished and professional appearance for your data charts.
Download our templates today and explore their features.
Features of the template:
- Slides are available in 4:3 & 16:9
- Get slides that are 100% customizable and easy to download
- Highly compatible with PowerPoint and Google Slides


You May Also Like These PowerPoint Templates
Add to Wishlist
Download
Edit


Add to Wishlist
Download
Edit

Add to Wishlist
Download
Edit


Add to Wishlist
Download
Edit


Add to Wishlist
Download
Edit


Add to Wishlist
Download
Edit


Add to Wishlist
Download
Edit

Add to Wishlist
Download
Edit


Showing20 of69,218 templates