Free - Bar chart template ppt slide
Free

 Canva
Canva

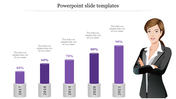
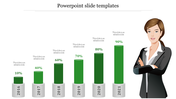
Functional Bar Chart Design PowerPoint Slide with Three Nodes
We used to check how our businesses or projects were performing to make them better or keep them running. Try our Bar Chart Template For Presentation to compare or analyze your project performance. The bar chart with the purple and blue theme will make your presentation stand out and gives a unique look. Also, the three tables help you to add different data about performance or the company's complete information in an investor meeting. All the layouts, tables, and charts are editable, so add your content, and you are ready to go.
Features of the Template
- 100 % customizable slides and easy to download
- Slides are available in different nodes & colors.
- This PowerPoint has three nodes.
- The slide contained 16:9 and 4:3 formats.
- Easy to change the slide colors quickly.
- It is a well-crafted template with an instant download facility.
- It is designed with a stunning theme design.
- It comes in a purple and blue theme.
- Highly compatible with PowerPoint, Google Slides and Canva templates


You May Also Like These PowerPoint Templates
Add to Wishlist
Download
Edit


Add to Wishlist
Download
Edit

Add to Wishlist
Download
Edit

Add to Wishlist
Download
Edit


Add to Wishlist
Download
Edit

Add to Wishlist
Download
Edit

Add to Wishlist
Download
Edit

Add to Wishlist
Download
Edit

Add to Wishlist
Download
Edit

Add to Wishlist
Download
Edit


Add to Wishlist
Download
Edit


Add to Wishlist
Download
Edit

Add to Wishlist
Download
Edit


Add to Wishlist
Download
Edit
