Innovative Free PowerPoint Charts Templates Presentation
Nodes

Colors


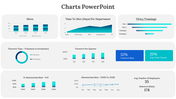
Submit Statistical Analysis With This Template:
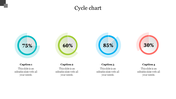
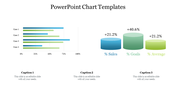
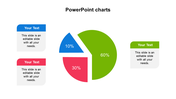
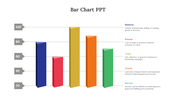
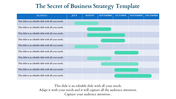
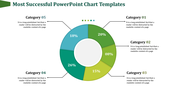
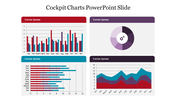
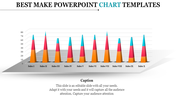
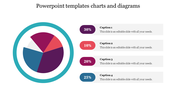
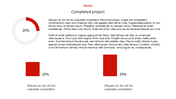
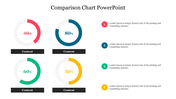
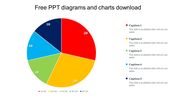
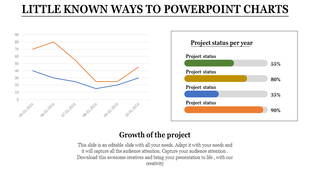
Have a look at this free PowerPoint charts template designed for you to provide precise details about your topic. You are provided with the graph to present analytical details in your presentation. Look at the different colors used in the lines, which can be edited as per your wish anytime.
Also, this template is available at an affordable cost which you can use several times once after downloading it. On the x and y-axis of the graph, you can provide the numbers and captions required for your ppt. On the right side of the template describing your graph, you can give details about your graph lines. Don't miss these free charts PowerPoint, and you will regret it later.
Features Of this Template:
- 100% customizable slides and easy to download.
- Slides are available in different nodes and colors.
- The Slide contained 16:9 and 4:3 format.
- Easy to change the Slides colors quickly.
- Well-crafted template with instant download facility.
- Informative graph with colors.
- The best template from SlideEgg.
More Collections for Innovative Free PowerPoint Charts Templates
Recommended based on this template.
Similar Templates to Innovative Free PowerPoint Charts Templates




Showing20 of69,218 templates