Free - PowerPoint Charts And Graphs and Google Slides Presentation

Free
Slide showcasing three different types of colored charts an area chart, a bar chart, and a line chart, with captions below.
P.ID : 10809
    1K+ views
    222 Downloads
    Get Custom Slides by Experts
    Instantly Access Templates in PowerPoint

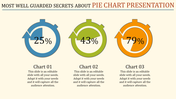
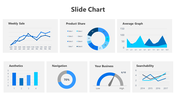
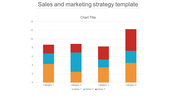
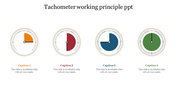
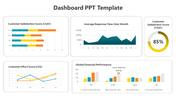
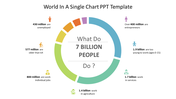
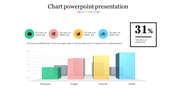
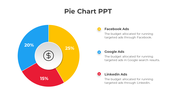
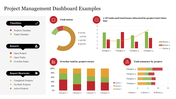
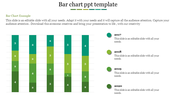
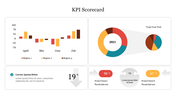
    Chart and Graph PowerPoint Template


    Transform your presentations into data-driven masterpieces with our Chart and Graph PowerPoint template. It is designed to elevate your data discourse. The slide comes with a sleek backdrop. It helps to witness a trio of powerful graphical representations. The first is a near-pie chart to add a visual flair. The second is a dynamic bar chart to deliver impact.

    The third is intersecting graphs to bring depth to your data narrative. Scale values on both axes enhance precision. Ample caption space awaits your insights, providing a narrative text area for your data story. An ideal template for analysts, researchers and business leaders. Download now to empower your present complex data with clarity and flair.

    Features of the template

    • The slide contains 16:9 and 4:3 formats.
    • Compatible with Google Slides Themes and PowerPoint.
    • 100% customizable slides and easy to download.
    • It is easy to change the colors of the slide quickly.
    • Well-crafted template with an instant download facility.
    Advertisement

    You May Also Like These PowerPoint Templates

    Add to Wishlist
    Download
    AI Customize
    KPI dashboard layout with a yellow header, two gauge in teal and green, bar metrics, and pie charts on a light background.
    Add to Wishlist
    Download
    AI Customize
    Seven rectangular sections with financial data on top and visual charts below, bordered in blue with organized text.
    Add to Wishlist
    Download
    AI Customize
    Speedometer graphic with six sections from green to red color gradient, each with icons and text areas.
    Add to Wishlist
    Download
    AI Customize
    Semi circular meter template with green, lime, yellow, and red sections, each displaying thumbs up icons, and text.
    Free
    Add to Wishlist
    Download
    AI Customize
    Effective Speedometer PowerPoint Template Presentation
    Add to Wishlist
    Download
    AI Customize
    Executive dashboard with a portfolio summary table listing project details and a pie chart displaying a quarterly report.
    Add to Wishlist
    Download
    AI Customize
    Dashboard template showing main categories, team metrics, and performance details with various visual elements.
    Add to Wishlist
    Download
    AI Customize
    Tachometer slide featuring a dial with a needle pointing to colored segments and four caption areas.
    Add to Wishlist
    Download
    AI Customize
    Set of three speedometer gauges indicating 70%, 50%, and 55%, with placeholder text areas placed in a white backdrop.
    Add to Wishlist
    Download
    AI Customize
    Central black speedometer with four surrounding colored icons, each detailing various aspects of kilometers.
    Add to Wishlist
    Download
    AI Customize
    Dashboard template showing a line chart of page likes over months with marked events in June and August.
    Add to Wishlist
    Download
    AI Customize
    Executive dashboard slide with a colorful line chart for yearly performance.
    Add to Wishlist
    Download
    AI Customize
    Dashboard Model PowerPoint slide showing statistics, graphs, and icons representing business data analysis.
    Add to Wishlist
    Download
    AI Customize
    Dashboard slide with six gauge meters displaying low to high ranges, each labeled with captions below.
    Add to Wishlist
    Download
    AI Customize
    Circular tachometer design with a central gauge and surrounding colored segments, each linked to captions on the right.
    Add to Wishlist
    Download
    AI Customize
    Financial dashboard with bar charts in pink and blue, colored circular pie charts, and teal boxes highlighting metrics.