Slidea Logo
Try it now — the new, easy way to turn your slides into an interactive experience.
Explore Now

Free - Hotel Management Dashboard PowerPoint And Google Slides

Free
Pack of 11 slides
P.ID : 76853
Advertisement
1 views
1 Downloads
Get Custom Slides by Experts
Enhance Your Presentations with Add-ins
Google Slides Add-in
Access templates directly in Google Slides
Microsoft PowerPoint Add-in
Access templates directly in PowerPoint
GPT Add-on
AI-powered presentation assistance

Hotel Management Dashboard PowerPoint, Google Slides, and Canva Template


Gain instant visibility into your hotel’s performance with this smartly designed hotel management dashboard presentation. Built with a clean multicolor theme, this 3-slide deck helps hospitality professionals track key metrics and present insights in a clear, professional format.

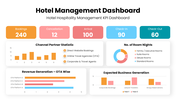
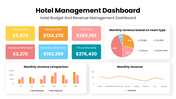
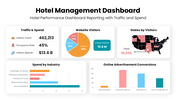
Thses slides includes essential views such as the Hotel Hospitality Management KPI Dashboard, Hotel Budget and Revenue Management Dashboard, and Hotel Performance Dashboard with Traffic and Spend reporting. Each slide is structured to highlight bookings, revenue trends, occupancy, expenses, and marketing performance for quick analysis and better decisions.

Designed for clarity and flexibility, this dashboard is fully editable and suitable for management reviews, operational meetings, and performance reporting. The visual layout makes complex hotel data easy to understand for both internal teams and stakeholders.


Take control of your hotel performance today. Download the Hotel Management Dashboard PPT and present hospitality data with confidence. Turn insights into actions that improve efficiency, revenue, and guest satisfaction.


Features of this template

  • 100% customizable slides and easy to download.
  • The slides contain 16:9 and 4:3 formats.
  • Easy to change the colors quickly.
  • Highly compatible with PowerPoint, Google Slides, and Canva templates.

You May Also Like These PowerPoint Templates

Free
Add to Wishlist
Download
AI Customize
Business slide featuring a circular layout with four orange sections and icons representing key aspects of business.
Add to Wishlist
Download
AI Customize
Logistics performance dashboard with two circular charts for failure distribution and delivery tracking, and a gauge meter.
Add to Wishlist
Download
AI Customize
KPI PowerPoint slide featuring three colored gauges for Revenue, Sales, and Sales Value with respective values.
Add to Wishlist
Download
AI Customize
KPI dashboard template PowerPoint slide featuring three sections for data visualization.
Add to Wishlist
Download
AI Customize
Four colored circular progress, one is higlighted in a box with a pie chart, and a bar chart labelled with sections.
Free
Add to Wishlist
Download
AI Customize
Pie chart in orange, red, green, and blue sections with two text labels on either side, highlighting sales performance.
Add to Wishlist
Download
AI Customize
KPI dashboard template with six sections which includes charts, graphs, and numerical data.
Add to Wishlist
Download
AI Customize
Concentric pentagons in black with text areas around each corner, forming a simple monochrome layout.
Add to Wishlist
Download
AI Customize
KPI themed slide with data visualization including pie charts, bar graphs, line graphs, and key metrics.
Add to Wishlist
Download
AI Customize
Project summary dashboard showing project statistics, budget, actual performance, and project performance by category.
Add to Wishlist
Download
AI Customize
Template displaying a structured flowchart for KPI types, categorized into qualitative and quantitative evaluations.
Add to Wishlist
Download
AI Customize
Slide with a businesswoman standing beside a colorful ring chart labeled on a board and four captions on the right.
Add to Wishlist
Download
AI Customize
KPI template displaying financial metrics, including sales, profitability, liquidity, and leverage, with two gauge charts.
Add to Wishlist
Download
AI Customize
Botanical data dashboard template  showing performance metrics for flower species, featuring line and bar charts.
Free
Add to Wishlist
Download
AI Customize
PowerPoint slide with a project dashboard showing two speedometers to represent project progress with captions.
Free
Add to Wishlist
Download
AI Customize
Five-level bar chart executive dashboard with colored blocks labeled with five levels, showing a gradual progression.