MILESTONE 🌟 5 Million+ creative minds trust SlideEgg! Grab 80% OFF

Procurement Dashboard PowerPoint And Google Slides

Procurement dashboard with colorful graphs, charts, and data blocks across supplier spend and cost metrics.
P.ID : 75255
    23 views
    7 Downloads
    Get Custom Slides by Experts
    Instantly Access Templates in PowerPoint

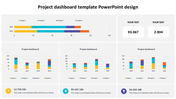
    Procurement Dashboard PPT, Google Slides, And Canva Template


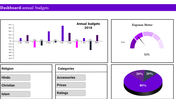
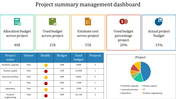
    A procurement dashboard is a strategic tool that provides real-time data and insights into procurement activities. It tracks key metrics, including cost savings, supplier performance, and procurement cycles. This 100% editable single-slide template is ideal for professionals who need a clear, visual overview of procurement performance and reporting efficiency.

    Purpose Of The Slides

    This dashboard slide is designed to present procurement KPIs in a single visual format. It highlights cost categories, cost reductions, procurement timelines, and supplier ratings. Whether used for internal reviews or stakeholder meetings, it enables users to present procurement analytics quickly and efficiently, utilizing a professional and visually appealing design.

    Who Can Use It?

    This template is ideal for procurement managers, supply chain analysts, finance teams, MBA students, and consultants. It helps professionals present cost data, vendor comparisons, contract performance, and budget tracking. The visual format supports quick reporting and data-driven discussions during strategic planning, team presentations, and internal audits.

    Special Key Features

    Clean layout with procurement icons, editable infographics, color-coded charts, and real-time data placeholders. Compatible with PowerPoint, Google Slides, and Canva. Download now to simplify your procurement reporting and make data-driven decisions effortlessly - perfect for professionals ready to streamline purchasing insights into one impactful slide.

    Features of this template


    • 100% customizable slides and easy to download.
    • The slides contain 16:9 and 4:3 formats.
    • Easy to change the colors quickly.
    • Highly compatible with PowerPoint, Google Slides, and Canva templates.
    Advertisement

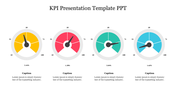
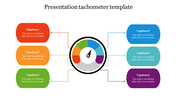
    You May Also Like These PowerPoint Templates

    Add to Wishlist
    Download
    AI Customize
    Tachometer PPT slide with 4 colorful gauges in red, orange, green, and blue, each with caption sections on a white backdrop.
    Add to Wishlist
    Download
    AI Customize
    KPI dashboard template PowerPoint slide featuring three sections for data visualization.
    Free
    Add to Wishlist
    Download
    AI Customize
    PowerPoint slide with a project dashboard showing two speedometers to represent project progress with captions.
    Add to Wishlist
    Download
    AI Customize
    Four colored circular progress, one is higlighted in a box with a pie chart, and a bar chart labelled with sections.
    Free
    Add to Wishlist
    Download
    AI Customize
    Five-level bar chart executive dashboard with colored blocks labeled with five levels, showing a gradual progression.
    Free
    Add to Wishlist
    Download
    AI Customize
    Business slide featuring a circular layout with four orange sections and icons representing key aspects of business.
    Add to Wishlist
    Download
    AI Customize
    KPI PowerPoint slide featuring three colored gauges for Revenue, Sales, and Sales Value with respective values.
    Add to Wishlist
    Download
    AI Customize
    KPI dashboard template with six sections which includes charts, graphs, and numerical data.
    Add to Wishlist
    Download
    AI Customize
    KPI slide with four semi circular gauges displaying metrics and overlapping colored circles showing numerical data.
    Add to Wishlist
    Download
    AI Customize
    Dashboard template with a world map showing highlighted regions, bar graphs, and financial data captions.
    Add to Wishlist
    Download
    AI Customize
    Project dashboard slides with Gantt chart, a burndown chart, and a timeline, using a palette of brown, green, and red.
    Add to Wishlist
    Download
    AI Customize
    Concentric pentagons in black with text areas around each corner, forming a simple monochrome layout.
    Add to Wishlist
    Download
    AI Customize
    Dashboard slide showing sales bar chart with a highlighted value and a gauge representing business metrics.
    Add to Wishlist
    Download
    AI Customize
    Tachometer PowerPoint template with four stages featuring colorful gauges and caption areas on a white backdrop.
    Add to Wishlist
    Download
    AI Customize
    Project summary dashboard showing project statistics, budget, actual performance, and project performance by category.
    Free
    Add to Wishlist
    Download
    AI Customize
    Pie chart in orange, red, green, and blue sections with two text labels on either side, highlighting sales performance.
    Add to Wishlist
    Download
    AI Customize
    KPI themed slide with data visualization including pie charts, bar graphs, line graphs, and key metrics.