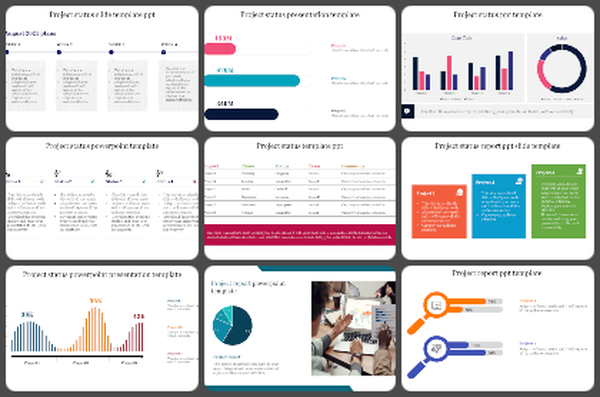
Project Summary Management Dashboard PPT and Google Slides

Dashboard with five colored budget boxes on top, a table listing projects, and a pie chart on the right.
P.ID : 31557
    1.7K+ views
    155 Downloads
    Get Custom Slides by Experts
    Instantly Access Templates in PowerPoint

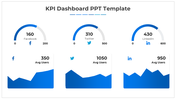
    Project Summary Management Dashboard Presentation

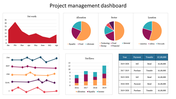
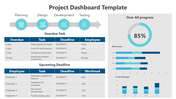
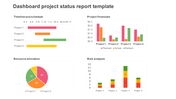
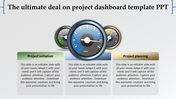
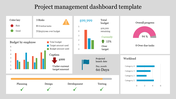
    Easily track your project progress with our Project Summary Management Dashboard PowerPoint and Google Slides. It's designed for anyone who wants a straightforward way to monitor their project. Our dashboard is clean and simple, with a white background and easy-to-understand icons. Each icon represents important aspects like project status, budget, timeline, and quality. With these visual cues, you can quickly spot strengths and weaknesses in your project. It'll help you make smart choices, use your resources wisely, and get better at managing projects.
     
    Whether you're experienced or just starting, our template is here to help you.
    Download our Project Summary Management Dashboard template today and gain clarity and control over your projects. Empower yourself with the knowledge and insight to make decisions. Optimize resource allocation and elevate your project management skills. Get the clarity you need to drive your projects to successful completion. Gain the power to make smart choices. 

    Features of the template:

    • Slides are available in different nodes & colors.
    • Easy to change the slide colors.
    • Well-crafted template with instant download.
    Advertisement

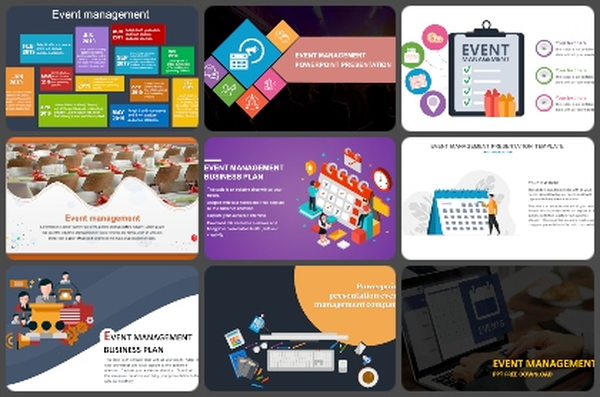
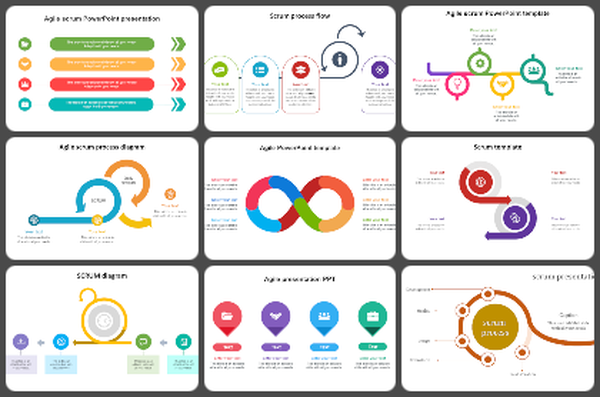
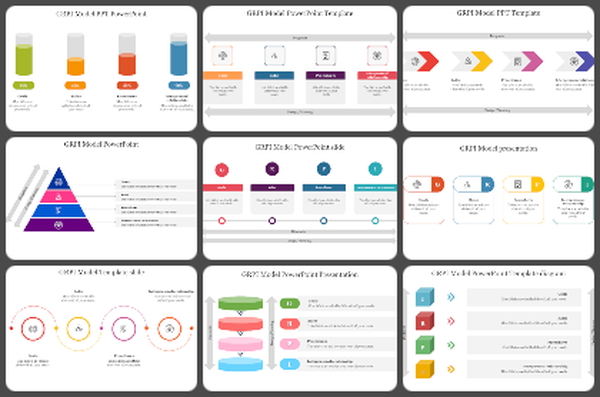
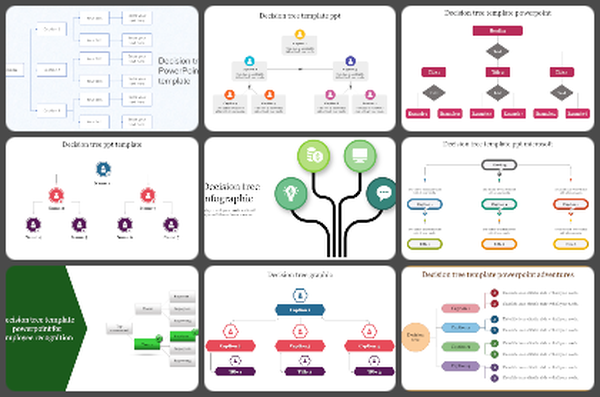
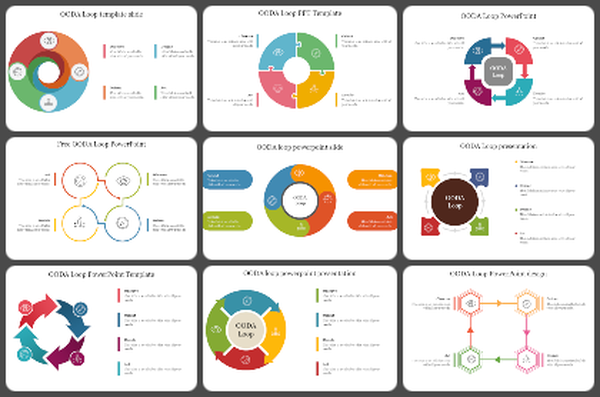
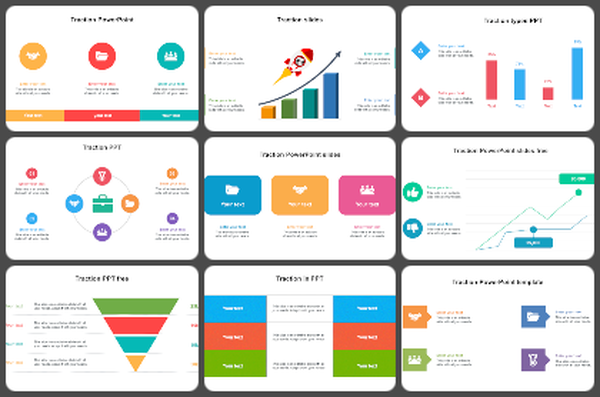
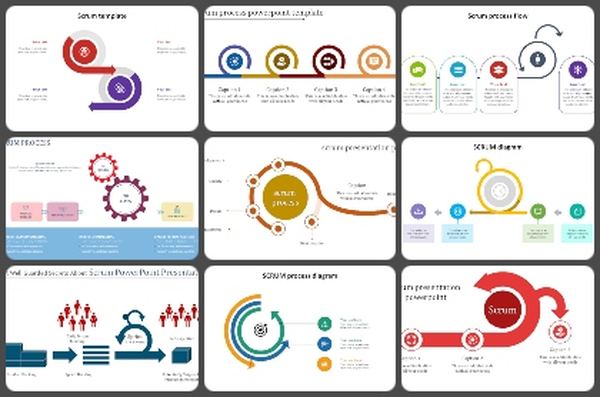
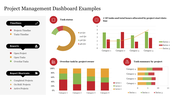
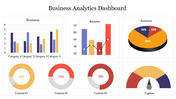
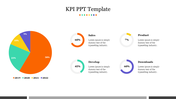
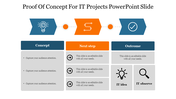
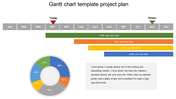
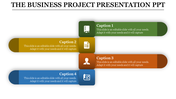
    You May Also Like These PowerPoint Templates

    Add to Wishlist
    Download
    AI Customize
    Triangular green project presentation template with icons and captions.
    Add to Wishlist
    Download
    AI Customize
    Astounding Timeline Project Planning Template PowerPoint
    Add to Wishlist
    Download
    AI Customize
    Project plan with eight horizontal yellow bars, a vertical milestone arrow, and a month labeled timeline.
    Add to Wishlist
    Download
    AI Customize
    Project timeline showing tasks with orange bars across 12 months, including milestones for start, progress, and end points.
    Add to Wishlist
    Download
    AI Customize
    Slide deck using vibrant shapes, process diagrams, and structured content for continuous delivery workflows.
    Add to Wishlist
    Download
    AI Customize
    Gantt chart inspired project timeline with six labeled tasks, key milestones, and a color coded schedule in purple.
    Add to Wishlist
    Download
    AI Customize
    Project PowerPoint template featuring icons of a robot, a podium, and devices, alongside colorful charts and graphs.
    Add to Wishlist
    Download
    AI Customize
    Timeline featuring circular bubble markers in blue, green, yellow, red, and teal, each paired with numbers 01 to 05.
    Add to Wishlist
    Download
    AI Customize
    A colorful project timeline with tasks and phases marked, including initiation, planning, execution, and milestones.
    Add to Wishlist
    Download
    AI Customize
    Project layout with three numbered triangles on the left, paired with a circular team photo framed by orange elements.
    Add to Wishlist
    Download
    AI Customize
    Project PPT slide showcasing four strategies marketing, development, efficiency, and expansion with green visuals.
    Add to Wishlist
    Download
    AI Customize
    Horizontal Gantt chart with tasks and phases in orange bars, spanning from January to December, marked by milestones.
    Add to Wishlist
    Download
    AI Customize
    Horizontal Gantt chart with tasks and phases in red bars, spanning from January to December, marked by milestones.
    Add to Wishlist
    Download
    AI Customize
    Project PowerPoint presentation slide featuring two images of people working creatively, along with placeholder text.
    Add to Wishlist
    Download
    AI Customize
    Organizational slide defining AAR with action items from Do More Off to Stop Doing, related to marketing efforts.
    Add to Wishlist
    Download
    AI Customize
    Gantt chart timeline with tasks from initiation to closure in blue bars, milestones marked in January and August.