Business Analytics Dashboard PPT Template & Google Slides


Elegant Business Analytics Dashboards
Download this amazingly created business analytics dashboard for some effective PowerPoint presentations. This business analytics dashboard contains everything that is needed for your business. It has A-Z analytical tools that play a vital role in checking and analyzing the work and progressions of your business.
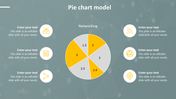
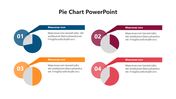
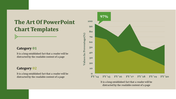
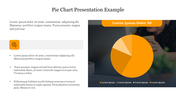
This PPT presentation template has a pie chart, bar charts, and meter charts for comparisons. Each chart allows you to enter four outcomes or departments of your business. You can also compare your company with other companies in terms of progression. This is quite remarkable as normally you don't get to see all in one template.
Features of this template:
- 100% customizable slides and easy to download.
- Slides available in different nodes and colors.
- The slide contained 16:9 and 4:3 format.
- Easy to change the slide colors quickly.
- It is a well-crafted template with an instant download facility.
- Saves time.
- Easy accessible and user-friendly.


You May Also Like These PowerPoint Templates
Add to Wishlist
Download
Edit

Add to Wishlist
Download
Edit


Add to Wishlist
Download
Edit

Add to Wishlist
Download
Edit

Add to Wishlist
Download
Edit

Add to Wishlist
Download
Edit

Add to Wishlist
Download
Edit

Add to Wishlist
Download
Edit

Add to Wishlist
Download
Edit

Add to Wishlist
Download
Edit


Add to Wishlist
Download
Edit

Add to Wishlist
Download
Edit

Add to Wishlist
Download
Edit

Add to Wishlist
Download
Edit

Add to Wishlist
Download
Edit

Add to Wishlist
Download
Edit

Add to Wishlist
Download
Edit

Add to Wishlist
Download
Edit
