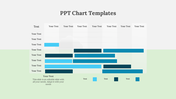
Mekko Graphic Infographics PowerPoint And Google Slides

Mekko Graphic Templates and Google Slides
Introducing our Mekko Graphic Infographics Charts template – your secret weapon for crafting presentations that are as unique as your ideas. Whether you're a data virtuoso, a business trailblazer, or a visual storyteller, get ready to turn numbers into captivating narratives.
Ignite Your Imagination: Think of our template as your creative laboratory. With Mekko Graphic Infographics Charts, you're not just presenting data; you're crafting visual masterpieces that leave a lasting impact.
Data, Meet Art: Simplify complexity with elegance. Our template lets you effortlessly weave intricate data into charts that are more than just visuals – they're works of art.
Elevate Your Influence: From boardrooms to lecture halls, your message will resonate. Our professionally designed graphics and layouts ensure your audience will remember your presentation long after it's over.
Effortless Brilliance: Don't let design hold you back. Spend your time perfecting your content, while our template takes care of the visuals.
Don't settle for ordinary presentations. Transform your data into extraordinary stories with our Mekko Graphic Infographics Charts template. Order now and watch your ideas come to life in a way that's refreshingly different and brilliantly creative!
Features of the template:
- 100% customizable slides and easy to download.
- This slide contains 16:9 and 4:3 formats.
- Highly compatible with Google Slides and PowerPoint.
- It is easy to change the slide colors quickly.
- It is a well-crafted template with an instant download facility


You May Also Like These PowerPoint Templates
Add to Wishlist
Download
AI Customize

Add to Wishlist
Download
AI Customize

Add to Wishlist
Download
AI Customize

Add to Wishlist
Download
AI Customize

Add to Wishlist
Download
AI Customize

Add to Wishlist
Download
AI Customize

Add to Wishlist
Download
AI Customize


Add to Wishlist
Download
AI Customize

Add to Wishlist
Download
AI Customize

Add to Wishlist
Download
AI Customize

Add to Wishlist
Download
AI Customize

Add to Wishlist
Download
AI Customize

Add to Wishlist
Download
AI Customize

Add to Wishlist
Download
AI Customize

Add to Wishlist
Download
AI Customize

Add to Wishlist
Download
AI Customize

Add to Wishlist
Download
AI Customize

Add to Wishlist
Download
AI Customize

Add to Wishlist
Download
AI Customize
