Creative PowerPoint Chart Templates Slide-Three Node

Slide with a horizontal bar chart on the left and 3D cylindrical percentage charts in blue, green, and teal, on the right.
P.ID : 47004
    154 views
    25 Downloads
    Get Custom Slides by Experts
    Instantly Access Templates in PowerPoint

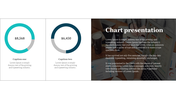
    Compact Charts And Animations Inserted Template

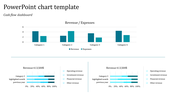
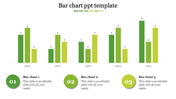
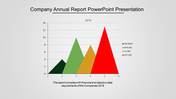
    Charts are the best option to convey your points on a detailed note. Templates are used to give a visual representation of your thoughts. The ideas in your heart are conveyed using charts, bar diagrams, and percentages. You can discuss your sales, goals, and average with the instruments given. The customization option is open for you, and you can insert them wherever necessary. The blue and green shades filled inside the diagrams make your work even more attractive and informative. So, get this template and make a useful slide. 

    Features of the template

    • 100% customizable slides and easy to download
    • Slides are available in different nodes & colors.
    • The slides contained 16:9 and 4:3 formats.
    • Easy to change the slide colors quickly.
    • Well-crafted template with an instant download facility.
    • Creative contents are presented.
    • Available in a variety of animations.
    Advertisement

    You May Also Like These PowerPoint Templates

    Free
    Add to Wishlist
    Download
    AI Customize
    Infographic of a bar chart representing yearly growth from 2018 to 2021 with a businesswoman illustration.
    Free
    Add to Wishlist
    Download
    AI Customize
    3D bar chart PowerPoint template showcasing data in four colored categories with a highlight and captions.
    Free
    Add to Wishlist
    Download
    AI Customize
    Horizontal chart with dual color bars in green and blue, displaying percentage values, and two captions on the right.
    Add to Wishlist
    Download
    AI Customize
    Slide with a vertical bar chart and four labeled sections, each paired with a unique color and icon.
    Free
    Add to Wishlist
    Download
    AI Customize
    Market research slide showing a line graph with three levels over the years 2016 and 2019, with a caption box.
    Free
    Add to Wishlist
    Download
    AI Customize
    A blue themed slide featuring a multi year bar chart comparison from 2016 to 2021 with three placeholders below.
    Free
    Add to Wishlist
    Download
    AI Customize
    3D chart with five colored bars in gold, red, green, teal, and orange, on individual bases, displaying percentages above.
    Free
    Add to Wishlist
    Download
    AI Customize
    Five step process chart with titled segments in shades of purple, showing stages and supporting information.
    Add to Wishlist
    Download
    AI Customize
    Innovative KWL Chart PowerPoint Presentation Slide
    Add to Wishlist
    Download
    AI Customize
    Area chart with overlapping blue, teal, and green sections, timeline on the axis, and three labeled boxes below.
    Add to Wishlist
    Download
    AI Customize
    A PowerPoint template displaying growth with stages represented by numbered circles showing data for different stages.
    Add to Wishlist
    Download
    AI Customize
    Color coded KWL chart template with sections for What I Know, What I Want to Know, and What I Learned with placeholder text.
    Add to Wishlist
    Download
    AI Customize
    A slide with a line chart slide showing data for Category 1 to 2 over several years with placeholder text.
    Add to Wishlist
    Download
    AI Customize
    Innovative Pie Chart Presentation Example Slide PPT
    Add to Wishlist
    Download
    AI Customize
    PowerPoint slide featuring four bar charts with different colors and captions, each representing different data percentages.
    Add to Wishlist
    Download
    AI Customize
    Scatter plot with differently sized bubbles in orange and purple, with a legend and product descriptions to the side.
    Add to Wishlist
    Download
    AI Customize
    Green color KWL chart presentation template with sections for What I Know, What I Want to Know, and What I Learned.