Amazing Chart Presentation Slide Templates Designs

Slide with two donut charts displaying values and a text section on the right with a blurred background image.
P.ID : 33936
    119 views
    3 Downloads
    Get Custom Slides by Experts
    Instantly Access Templates in PowerPoint

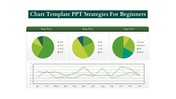
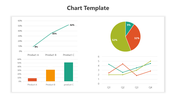
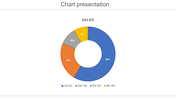
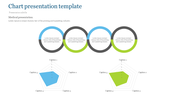
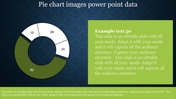
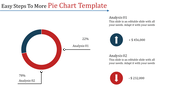
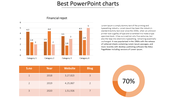
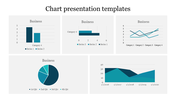
    Chart Presentation Templates and Google Slides


    In today’s fast-paced business environment, mastering the art of chart presentation is essential for impactful communication. Using professional shades and a circular design with two nodes, a chart presentation becomes a powerful tool for data visualization. This approach not only simplifies complex data but also makes it engaging and easy to understand. A well-designed chart captures attention, emphasizes key points, and drives home the message with clarity.

    For creative presentations, especially in business settings, incorporating a circular design offers a visually appealing way to showcase data relationships and trends. With two distinct nodes, you can highlight crucial data points and their interactions effectively. The professional color palette adds a layer of sophistication, ensuring your presentation stands out and resonates with your audience.

    Whether you're presenting quarterly results, market analysis, or strategic plans, a thoughtfully crafted chart presentation transforms raw data into a compelling story. It’s about making data visualization not just informative but also memorable, helping your audience grasp insights quickly and make informed decisions. Embrace this approach to elevate your business presentations to new heights.

    Features of this template

    • 100% customizable slides and easy to download.
    • The slide contains 16:9 and 4:3 formats.
    • Easy to change the colors of the slide quickly.
    • Highly compatible with PowerPoint and Google Slides.
    Advertisement

    You May Also Like These PowerPoint Templates

    Free
    Add to Wishlist
    Download
    AI Customize
    Four cylindrical blue bars in a row next to a woman in a black suit in a simple design layout.
    Add to Wishlist
    Download
    AI Customize
    Market research dashboard with a segmented horizontal bar chart analyzing brand perception and a donut chart.
    Add to Wishlist
    Download
    AI Customize
    Green circular chart with five segments labeled by categories and percentages, with descriptions around it.
    Add to Wishlist
    Download
    AI Customize
    Comparison chart with vertical bars on blue and yellow split background, and icons for male and female with captions.
    Free
    Add to Wishlist
    Download
    AI Customize
    An annual sales template with sections labeled Heading 1 to 5 and a pie chart illustrating various percentages with text.
    Free
    Add to Wishlist
    Download
    AI Customize
    Illustrative slide combining a pie chart with 45% in green and five silhouette icons to convey data distribution.
    Free
    Add to Wishlist
    Download
    AI Customize
    Vertical bar chart with three purple bars increasing from 2019 to 2021, each labeled with percentages, and a businesswoman.
    Add to Wishlist
    Download
    AI Customize
    PowerPoint bar chart design slide featuring various colored flags and labeled categories at the bottom.
    Free
    Add to Wishlist
    Download
    AI Customize
    Business pie chart template with a car background, featuring sections labeled with text and pie chart values.
    Free
    Add to Wishlist
    Download
    AI Customize
    PowerPoint slide showing a line chart with data for 2018, 2019, 2020, and 2021, displaying percentages for each year.
    Add to Wishlist
    Download
    AI Customize
    Customized PowerPoint Charts Template Presentation
    Add to Wishlist
    Download
    AI Customize
    Colorful pie chart with six segments, each labeled with percentages and color-coded text on the right.
    Free
    Add to Wishlist
    Download
    AI Customize
    Weekly bar chart with green bars showing Style 1 to Style 4 timelines, accompanied by a tilted yellow note box.
    Add to Wishlist
    Download
    AI Customize
    Line graph displaying trends across four categories with three distinct colored lines and percentage highlights below.
    Free
    Add to Wishlist
    Download
    AI Customize
    Five vertical purple bars in a row, each on a gray base, with a businesswoman figure on the right side.
    Free
    Add to Wishlist
    Download
    AI Customize
    Template with six green bar graphs labeled by years from 2016 to 2021, and a woman in a formal outfit.
    Free
    Add to Wishlist
    Download
    AI Customize
    Bar chart comparing business targets and profits across quarters, with orange and blue bars labeled by month.
    Free
    Add to Wishlist
    Download
    AI Customize
    PPT slide with a line chart showing monthly data and two pie charts for quarterly breakdown.
    Add to Wishlist
    Download
    AI Customize
    Colorful pie chart in PowerPoint slide showing 60, 30, and 10 percent segments with text boxes on a white backdrop.