Simple PowerPoint Bar Chart Design For Your Presentation

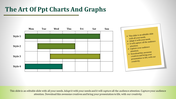
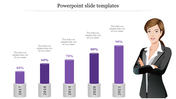
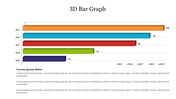
Elegant Bar Chart Presentation Template
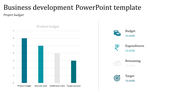
Bar charts help to present categorical, discrete, or continuous variables grouped in class intervals. They comprise an axis and a series of labeled horizontal or vertical bars. Picture your comparative values in a bar chart with our Elegant Bar Chart Presentation Template. It is crafted with a vibrant graphical bar chart diagram that looks appealing. The three nodes of this template are built with huge text areas. They are handy for financial projections and business growth data. It also includes the graphics of country flags on each bar, which is helpful for international business data display. Download this ideal slide for simple data representations with impactful visual infographics.
Features of the template
- 100% customizable slides and easy to download.
- Slides are available in different nodes & colors.
- The slide contained 16:9 and 4:3 formats.
- Easy to change the slide colors quickly.
- Well-crafted template with instant download facility.
- Vibrant bar chart graphics inserted.
- A Handy slide for quick presentations.


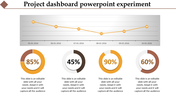
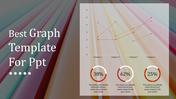
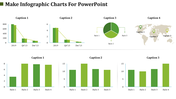
You May Also Like These PowerPoint Templates
Add to Wishlist
Download
AI Customize

Add to Wishlist
Download
AI Customize

Add to Wishlist
Download
AI Customize

Add to Wishlist
Download
AI Customize

Add to Wishlist
Download
AI Customize

Add to Wishlist
Download
AI Customize

Add to Wishlist
Download
AI Customize

Add to Wishlist
Download
AI Customize

Add to Wishlist
Download
AI Customize

Add to Wishlist
Download
AI Customize

Add to Wishlist
Download
AI Customize

Add to Wishlist
Download
AI Customize

Free
Add to Wishlist
Download
AI Customize

Add to Wishlist
Download
AI Customize

Add to Wishlist
Download
AI Customize

Add to Wishlist
Download
AI Customize

Add to Wishlist
Download
AI Customize

Add to Wishlist
Download
AI Customize

Add to Wishlist
Download
AI Customize

Add to Wishlist
Download
AI Customize
