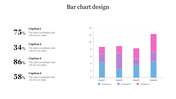
Free - Customizable Bar Chart PowerPoint Template Slide

Free
Colorful bar chart with three data categories and corresponding bars each with caption areas.
P.ID : 65489
    700 views
    254 Downloads
    Get Custom Slides by Experts
    Instantly Access Templates in PowerPoint

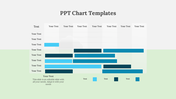
    Free Six Nodded Bar Chart PPT Slide 

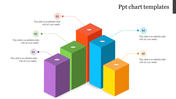
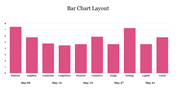
    Download this Free Bar Chart PowerPoint Template to present your business information in a bar chart format. You can use this slide for your business meetings to showcase the data. It is fully editable so that you can customize the values given in the chart according to your needs. You can also edit the background, font, nodes, colors, etc.

    About the template:

    The Free Bar Chart PowerPoint Template includes a well-crafted chart with six nodes. It helps to present the business, suppliers, and community. It also includes text holders to present your descriptions. The bright colors used in the graph against the white background will make your presentation captivating. Find more Bar Chart Presentation Slides from our site.

    Features of this template:

    1. 100% customizable slides and easy to download.
    2. Slides available in different nodes & colors.
    3. The slide contained 16:9 and 4:3 format.
    4. Easy to change the slide colors quickly.
    5. Well-crafted template with instant download facility.
    6. It has a bright, colorful bar chart.
    7. Highly compatible with PowerPoint, Google Slides and Canva templates

    Advertisement

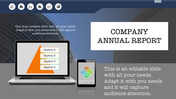
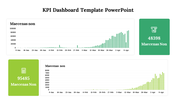
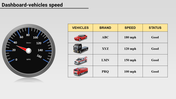
    You May Also Like These PowerPoint Templates

    Add to Wishlist
    Download
    AI Customize
    A donut chart with four sections in green, red, and white, labeled with percentages, and text boxes around it.
    Free
    Add to Wishlist
    Download
    AI Customize
    PPT slide with a blue bar chart showing percentages for the years 2016 to 2021 with a woman standing next to the chart.
    Add to Wishlist
    Download
    AI Customize
    Business column chart template showing four bar sections, each representing industries with icons and data percentages.
    Add to Wishlist
    Download
    AI Customize
    Colorful bar chart slide for an annual report in PowerPoint, displaying monthly data from January to December.
    Add to Wishlist
    Download
    AI Customize
    PowerPoint template with two bar charts, one green, and one blue, representing four categories.
    Free
    Add to Wishlist
    Download
    AI Customize
    Red themed template with four circular percentage indicators over rounded bars, aligned with icons and captions.
    Add to Wishlist
    Download
    AI Customize
    Progress Bar Design PowerPoint Template & Google Slides
    Add to Wishlist
    Download
    AI Customize
    Slide deck with various colorful bar charts, featuring vertical and horizontal bars in different colors to represent data.
    Add to Wishlist
    Download
    AI Customize
    Blank bar chart template featuring three series of data across four categories, with orange, green, and blue bars.
    Add to Wishlist
    Download
    AI Customize
    3D bar chart with cylindrical bars in yellow, orange, pink, teal, and green, showing percentages and captions below.
    Add to Wishlist
    Download
    AI Customize
    Stunning Revenue Graph PowerPoint Presentation Slide
    Add to Wishlist
    Download
    AI Customize
    Horizontal bar graph slide with four color coded categories in green, yellow, red, and purple, with text descriptions.
    Add to Wishlist
    Download
    AI Customize
    A slide displaying a sample bar chart with monthly data from may to december, featuring colorful bars and descriptive text.
    Add to Wishlist
    Download
    AI Customize
    Horizontal chart with four colored bars, each with a color coded icon and caption on the left.
    Add to Wishlist
    Download
    AI Customize
    Bar chart in four distinct bars in multi colour each showing data points with corresponding labels, values and caption areas.
    Add to Wishlist
    Download
    AI Customize
    Chart PowerPoint slide with bar graph and four icons representing data, calendar, and people with placeholder text.
    Add to Wishlist
    Download
    AI Customize
    3D bar graph slide displaying data trends across five years, with color coded bars representing values with placeholder text.