Innovative Bar Charts PowerPoint Presentation Template

Bar chart in four distinct bars in multi colour each showing data points with corresponding labels, values and caption areas.
P.ID : 65493
    597 views
    77 Downloads
    Get Custom Slides by Experts
    Instantly Access Templates in PowerPoint

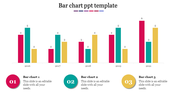
    Four Nodded Bar Chart PPT Slide

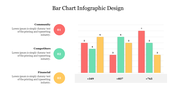
    Are you trying to analyze your business performance using a chart? Download this Innovative Bar Charts PowerPoint Template and make an outstanding business presentation. It is an excellent tool that is highly customizable and can be used with any kind of presentation. It allows you to modify the look and feel of the slide according to your needs. Download Now!

    About the template:


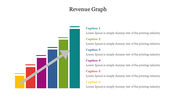
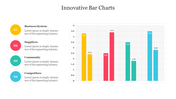
    The Innovative Bar Charts PowerPoint Template is creatively designed with a multicolor vertical bar chart. It helps to present the statistical data of your business system, suppliers, community, and competitors. With this slide, your audience can easily and quickly understand and compare the data. Get more Bar Chart Presentation Example Slides from SlideEgg!


    Features of this template:

    1. 100% customizable slides and easy to download.
    2. Slides available in different nodes & colors.
    3. The slide contained 16:9 and 4:3 format.
    4. Easy to change the slide colors quickly.
    5. Well-crafted template with instant download facility.
    6. It has a bar chart in captivating colors.
    Advertisement

    You May Also Like These PowerPoint Templates

    Add to Wishlist
    Download
    AI Customize
    Comparison chart with horizontal green bars displaying data for four examples across three series.
    Add to Wishlist
    Download
    AI Customize
    3D bar graph slide displaying data trends across five years, with color coded bars representing values with placeholder text.
    Add to Wishlist
    Download
    AI Customize
    Stacked bar chart template with green gradients, showing data from 2017 to 2020, with labeled sections.
    Free
    Add to Wishlist
    Download
    AI Customize
    Colorful bar chart with three data categories and corresponding bars each with caption areas.
    Add to Wishlist
    Download
    AI Customize
    Colorful bar graph illustrating monthly data with values for each month from january to december.
    Add to Wishlist
    Download
    AI Customize
    Slide with a businessman holding a megaphone projecting speech bubble displaying communication icons, and bar charts below.
    Add to Wishlist
    Download
    AI Customize
    Illustration of a chart with yellow, red, and green horizontal bars displaying percentages and paper boat icons on waves.
    Free
    Add to Wishlist
    Download
    AI Customize
    Three separate bar charts in red tones, each section labeled with a percentage and caption.
    Add to Wishlist
    Download
    AI Customize
    Colorful progress bars in rows, showing numbered squares in red, teal, purple, and blue, with text on the right.
    Free
    Add to Wishlist
    Download
    AI Customize
    Technology themed slide with five horizontal purple bars showing percentages, icons, and descriptive captions.
    Add to Wishlist
    Download
    AI Customize
    Horizontal bar graph slide with four colored steps and corresponding descriptions on the right.
    Add to Wishlist
    Download
    AI Customize
    Three charts with orange bars displayed against dark backgrounds, each labeled with categories and series.
    Add to Wishlist
    Download
    AI Customize
    Progress bar template showing Process A and B side by side, with four stages and completion percentages.
    Add to Wishlist
    Download
    AI Customize
    Presentation slide featuring multicolored bar graphs for categories and a purple and gray pie chart with text sections below.
    Add to Wishlist
    Download
    AI Customize
    Vertical bar chart in red shades, displaying yearly data from 2017 to 2020, with detailed labels on the right.
    Add to Wishlist
    Download
    AI Customize
    Green shaded bar chart displaying data from 2016 to 2021, with three numbered captions below.
    Add to Wishlist
    Download
    AI Customize
    Chart slide showing market supply data from 2004 to 2014 with red bars and percentage annotations.
    Free
    Add to Wishlist
    Download
    AI Customize
    3D bar chart PowerPoint template showcasing data in four colored categories with a highlight and captions.
    Free
    Add to Wishlist
    Download
    AI Customize
    Horizontal chart with dual color bars in green and blue, displaying percentage values, and two captions on the right.