Free - Bar Chart PowerPoint Template for Data Visualization
Free

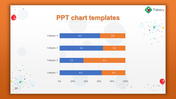
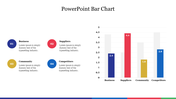
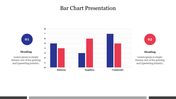
Bar Chart PowerPoint Template
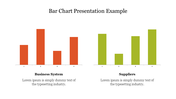
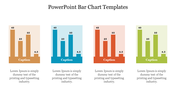
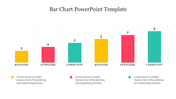
Reorganize the way you present business data with our Bar Chart PowerPoint Template. The slide showcases four vibrant bars ascending in numerical order. It creates a visually appealing representation of your business strategies. Each bar is accompanied by four nodes. It is strategically placed to offer concise and compelling descriptions.
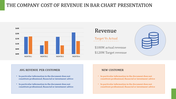
Ideal for analysts, financial experts and business professionals. A suitable template for illustrating financial trends, market growth or performance metrics. The template will be your user-friendly and go-to solution for impactful data communication. Download the template today, since your audience deserves more than just numbers.
Features of the template
- The slide contains 16:9 and 4:3 formats.
- Compatible with Google slide themes and PowerPoint.
- 100% customizable slides and free to download.
- It is easy to change the colors of the slide quickly.
- Well-crafted template with an instant download facility.


You May Also Like These PowerPoint Templates


Add to Wishlist
Download
Edit

Add to Wishlist
Download
Edit


Add to Wishlist
Download
Edit


Add to Wishlist
Download
Edit

Add to Wishlist
Download
Edit


Add to Wishlist
Download
Edit

Add to Wishlist
Download
Edit


