Get Bar Chart PowerPoint Templates for Presentation

Bar chart in PowerPoint displaying data with titles and placeholders for example text and additional information.
P.ID : 4194
    860 views
    33 Downloads
    Get Custom Slides by Experts
    Instantly Access Templates in PowerPoint

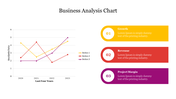
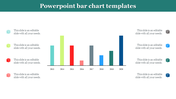
    Practical Bar Chart PowerPoint Template


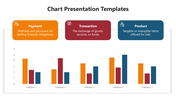
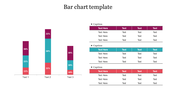
    Download our bar chart PowerPoint templates to present your valuable data. Tailored for professionals, analysts, and presenters seeking a polished and engaging way to showcase data, this slide features a sleek bar chart with three bars, elegantly presented against a soothing blue theme.

    Best for conveying performance metrics, project progress, or any quantitative data. Also, the text area allows you to add context and details seamlessly. Whether you're presenting in a corporate setting, educational environment, or business meeting, this template ensures your information is communicated with clarity and impact.

    Are you ready to transform your presentations? Get our bar chart PowerPoints, where precision meets visual appeal. Propel your presentations, engage your audience, and convey your data with confidence. Your journey to impactful data presentations starts here!

    Features of the template


    • 100% customizable slides are easy to download.
    • Slides are available in different colors.
    • The slide has 4:3 and 16:9 formats.
    • It is easy to change the slide colors quickly.
    • It has a cute design to impress an audience.
    • Create feature-rich, animated presentations.
    Advertisement

    You May Also Like These PowerPoint Templates

    Add to Wishlist
    Download
    AI Customize
    KPI dashboard with bar graphs showing data trends over time and two green summary boxes.
    Add to Wishlist
    Download
    AI Customize
    Vehicle dashboard slide featuring a speedometer on the left and a detailed table on the right with its brands.
    Free
    Add to Wishlist
    Download
    AI Customize
    A PPT chart template featuring a table layout with rows labeled Text and columns with bar charts in different shades of blue.
    Add to Wishlist
    Download
    AI Customize
    Bar chart slide design with stacked bars showing three categories per item and percentage captions on the left.
    Add to Wishlist
    Download
    AI Customize
    A donut chart with four sections in green, red, and white, labeled with percentages, and text boxes around it.
    Free
    Add to Wishlist
    Download
    AI Customize
    PPT slide with a blue bar chart showing percentages for the years 2016 to 2021 with a woman standing next to the chart.
    Add to Wishlist
    Download
    AI Customize
    Business column chart template showing four bar sections, each representing industries with icons and data percentages.
    Add to Wishlist
    Download
    AI Customize
    Colorful bar chart slide for an annual report in PowerPoint, displaying monthly data from January to December.
    Add to Wishlist
    Download
    AI Customize
    Colorful bar chart PPT template displaying four sections with data values and corresponding captions for 2018 to 2021.
    Add to Wishlist
    Download
    AI Customize
    Gantt chart with a task breakdown, progress percentages, and a status table for project planning and execution.
    Free
    Add to Wishlist
    Download
    AI Customize
    Five-step timeline with icons for connectivity, achievement, computers, pie chart, and security, paired with text.
    Free
    Add to Wishlist
    Download
    AI Customize
    Line chart with data points marked by blue squares and black dots, displaying values from 2006 to 2014.
    Add to Wishlist
    Download
    AI Customize
    Gantt chart with colorful horizontal bars spanning from January to June, representing project timelines and milestones.
    Free
    Add to Wishlist
    Download
    AI Customize
    Slide with line and trends charts, showing five columns of data with placeholder text for each chart segment.
    Free
    Add to Wishlist
    Download
    AI Customize
    PowerPoint slide with a bar chart showcasing three data series for different examples.
    Add to Wishlist
    Download
    AI Customize
    Chart layout with stacked bar graphs in red, yellow, green, and teal representing A1 to A8, with captions above.
    Add to Wishlist
    Download
    AI Customize
    3D cone charts in blue shades with percentage labels, showing two datasets with a legend on the right.
    Add to Wishlist
    Download
    AI Customize
    Gantt chart template illustrating project phases, milestones, and a timeline structure from January to December.
    Add to Wishlist
    Download
    AI Customize
    Slide showing a bar chart with values for 2017, 2018, 2019, and 2020, with each year represented in different shades of blue.