Project Dashboard PowerPoint And Google Slides Template

Dashboard overview slide displaying traffic, payment, server load, expenses, and product metrics using graphs and charts.
P.ID : 1860
    895 views
    71 Downloads
    Get Custom Slides by Experts
    Instantly Access Templates in PowerPoint

    Project Dashboard PowerPoint Template


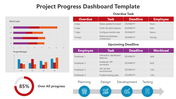
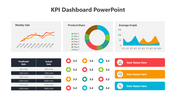
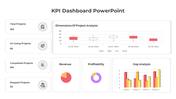
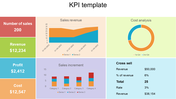
    Streamline project management and gain valuable insights with the Project Dashboard template, a dynamic tool designed to provide a comprehensive overview of project progress and performance. By consolidating key project metrics, milestones, and tasks into a single, easy-to-read interface, the Project Dashboard enables project managers and stakeholders to track progress, identify potential risks, and make informed decisions in real-time. With customizable features and intuitive design options, this template allows users to tailor their dashboard to suit their specific project requirements and objectives. Whether you're managing a small team or overseeing complex projects, the Project Dashboard template empowers you to stay organized, stay informed, and stay ahead of deadlines. Download it today to streamline your project management processes and drive successful project outcomes.

    Features of this template


    • 100% customizable slides and easy to download.
    • Slides are available in different nodes & colors.
    • The slide contained 16:9 and 4:3 formats.
    • Easy to change the slide colors quickly.
    • It is a well-crafted template with an instant download facility.
    Advertisement

    You May Also Like These PowerPoint Templates

    Add to Wishlist
    Download
    AI Customize
    Project overview dashboard template with area chart, line charts for time intervals, and percentage indicators.
    Add to Wishlist
    Download
    AI Customize
    Colorful Tachometer slide with color coded sections from light to BMI with placeholder text.
    Add to Wishlist
    Download
    AI Customize
    Slide featuring a blue-toned pie chart representing sales revenue percentages, with captions areas for each segment.
    Add to Wishlist
    Download
    AI Customize
    Slide with three tachometer dials in blue, purple, and pink, each aligned above a matching caption box.
    Add to Wishlist
    Download
    AI Customize
    Dashboard graphics displaying vehicle speeds with a data table listing vehicles, brands, and status.
    Add to Wishlist
    Download
    AI Customize
    Row of pie charts with varying color schemes for data visualization each place diwth caption areas.
    Add to Wishlist
    Download
    AI Customize
    Dashboard chart displaying social media subscribers by gender, age, most read articles, and categories in 2019.
    Add to Wishlist
    Download
    AI Customize
    Three pie charts in red, yellow, and blue with percentage values, arranged horizontally with text below.
    Add to Wishlist
    Download
    AI Customize
    Six-month Gantt chart template spanning July to December 2020 with weekly divisions and task rows.
    Add to Wishlist
    Download
    AI Customize
    Five segment pie chart in orange, blue, red, green, and pink, each with number and connected with text areas.
    Free
    Add to Wishlist
    Download
    AI Customize
    Line chart in teal showing data points from 2013 to 2020 on a white background, with five icons listed on the right.
    Free
    Add to Wishlist
    Download
    AI Customize
    Histogram on the left and Pareto chart in pink and orange with cumulative line on the right.
    Add to Wishlist
    Download
    AI Customize
    Project dashboard slides with Gantt chart, a burndown chart, and a timeline, using a palette of brown, green, and red.
    Free
    Add to Wishlist
    Download
    AI Customize
    Four blue pyramid shapes in ascending size, labeled with percentages, aligned over a horizontal gray bar.
    Add to Wishlist
    Download
    AI Customize
    Tachometer PowerPoint slide with gauges indicating 10, 20, and 30 with captions for each.
    Free
    Add to Wishlist
    Download
    AI Customize
    Dashboard with a timeline bar chart in green and purple, labeled with milestones for savings and investments.
    Add to Wishlist
    Download
    AI Customize
    A pie chart featuring five segments, each labeled with percentages, surrounded by text on a blue background.