Dashboard PowerPoint Presentation Template

Dashboard template with a semi-circular gauge indicating performance with a blurred image and caption areas.
P.ID : 8936
    237 views
    15 Downloads
    Get Custom Slides by Experts
    Instantly Access Templates in PowerPoint

    Dashboard PowerPoint Presentation Template

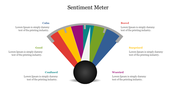
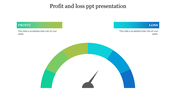
    Embark on a journey of data-driven excellence with our Dashboard PowerPoint Presentation Template. The image features a dynamic red and grey speedometer, its needle confidently pointing to the right, symbolizing progress. Compelling bullet points accompany the speedometer, highlighting the myriad benefits of harnessing the power of a dashboard presentation.

    This template is your go-to solution for presenting complex data in a visually engaging manner. Whether you're reporting business metrics, project progress, or survey results, the Dashboard PowerPoint Presentation Template ensures that your information is not only understood but also leaves a lasting impact.

    Tailored for professionals across industries – business analysts, project managers, executives, educators, and anyone seeking to convey data insights effectively.

    Available in "16:9" and "4:3" formats to cater to various screen ratios. Convenient zip formats for easy sharing and accessibility. Experience the flexibility of a 100% customizable template, allowing you to tailor the design to your specific needs. Download our template now and turn your data into a powerful visual story!
    Advertisement

    You May Also Like These PowerPoint Templates

    Add to Wishlist
    Download
    AI Customize
    KPI dashboard layout with a yellow header, two gauge in teal and green, bar metrics, and pie charts on a light background.
    Add to Wishlist
    Download
    AI Customize
    Seven rectangular sections with financial data on top and visual charts below, bordered in blue with organized text.
    Add to Wishlist
    Download
    AI Customize
    Customer Service PowerPoint Slide for Effective Service
    Add to Wishlist
    Download
    AI Customize
    Speedometer graphic with six sections from green to red color gradient, each with icons and text areas.
    Add to Wishlist
    Download
    AI Customize
    Semi circular meter template with green, lime, yellow, and red sections, each displaying thumbs up icons, and text.
    Free
    Add to Wishlist
    Download
    AI Customize
    Effective Speedometer PowerPoint Template Presentation
    Add to Wishlist
    Download
    AI Customize
    Executive dashboard with a portfolio summary table listing project details and a pie chart displaying a quarterly report.
    Add to Wishlist
    Download
    AI Customize
    Dashboard template showing main categories, team metrics, and performance details with various visual elements.
    Add to Wishlist
    Download
    AI Customize
    Tachometer slide featuring a dial with a needle pointing to colored segments and four caption areas.
    Add to Wishlist
    Download
    AI Customize
    Set of three speedometer gauges indicating 70%, 50%, and 55%, with placeholder text areas placed in a white backdrop.
    Add to Wishlist
    Download
    AI Customize
    Central black speedometer with four surrounding colored icons, each detailing various aspects of kilometers.
    Add to Wishlist
    Download
    AI Customize
    Four section layout showing diabetes statistics, symptoms, prevention methods, and a bar chart for illness increase trends.
    Add to Wishlist
    Download
    AI Customize
    Dashboard template showing a line chart of page likes over months with marked events in June and August.
    Add to Wishlist
    Download
    AI Customize
    Executive dashboard slide with a colorful line chart for yearly performance.
    Add to Wishlist
    Download
    AI Customize
    Dashboard Model PowerPoint slide showing statistics, graphs, and icons representing business data analysis.
    Add to Wishlist
    Download
    AI Customize
    Dashboard slide with six gauge meters displaying low to high ranges, each labeled with captions below.
    Add to Wishlist
    Download
    AI Customize
    Dashboard with a world map and percentage markers, semi circle expense meters, and orange bar charts showing metrics.
    Add to Wishlist
    Download
    AI Customize
    Circular tachometer design with a central gauge and surrounding colored segments, each linked to captions on the right.