Dashboard PPT Template Presentation and Google Slides

Seven rectangular sections with financial data on top and visual charts below, bordered in blue with organized text.
P.ID : 21131
    1.4K+ views
    150 Downloads
    Get Custom Slides by Experts
    Instantly Access Templates in PowerPoint

    Dashboard PPT Templates and Google Slides

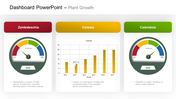
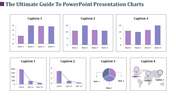
    Here is an amazing collection of Dashboard PowerPoint Templates! These templates are super cool gadgets that help you track and visualize important information in a fun and easy way.
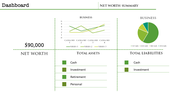
    Imagine you have a special control panel with buttons and lights that show you everything you need to know. That's exactly what a dashboard is! Our templates allow you to create your very own digital control panel in a presentation. You can display key data, such as sales, progress, or even game scores, all in one place.
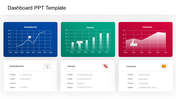
    But wait, it gets even better! Using a dashboard is as simple as playing a video game. Just plug in your data and watch as the numbers and charts come to life. You can use colorful graphs, icons, and tables to make the information clear and exciting.
    So whether you're a student tracking your grades or a business owner monitoring your performance, our Dashboard PowerPoint Templates are the perfect tool to present your data professionally and engagingly.
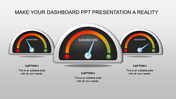
    Get ready to level up your presentations with our accessible and visually stunning Dashboard PowerPoint Templates. Start visualizing your data like a pro today!

    Features of the template 

    • 100% customizable slides and easy to download. 
    • Slides are available in different nodes & colors. 
    • The slide contains 16:9 and 4:3 formats. 
    • Easy to change the colors of the slides quickly. 
    • Well-crafted template with an instant download facility. 
    • Highly compatible with PowerPoint and Google Slides. 
    Advertisement

    You May Also Like These PowerPoint Templates

    Add to Wishlist
    Download
    AI Customize
    KPI dashboard template with four gauges in blue, green, orange, and red, alongside a flowchart with colored boxes.
    Add to Wishlist
    Download
    AI Customize
    Colorful dashboard PPT template featuring financial figures, text placeholders, and a radar chart for visual data analysis.
    Free
    Add to Wishlist
    Download
    AI Customize
    Slide featuring a bar graph and line chart showing monthly money transactions, alongside silhouettes of people shaking hands.
    Free
    Add to Wishlist
    Download
    AI Customize
    PowerPoint template featuring a colorful dashboard with bar graphs, pie charts, progress rings, and a timeline for data.
    Add to Wishlist
    Download
    AI Customize
    Dashboard showing expense meters, global percentages on a map, and a bar chart visualizing data distribution.
    Add to Wishlist
    Download
    AI Customize
    Slide deck with KPI charts and graphs for business analysis, including financials, HR performance, and customer service.
    Add to Wishlist
    Download
    AI Customize
    KPI dashboard template with a line chart, progress indicators, and bar graphs showing different performance metrics.
    Free
    Add to Wishlist
    Download
    AI Customize
    Free KPI PPT Template For Presentation & Google Slides
    Free
    Add to Wishlist
    Download
    AI Customize
    Dashboard layout includes a line graph, pie chart, and three bar graphs, all colored in red, green, and blue.
    Free
    Add to Wishlist
    Download
    AI Customize
    Project dashboard slide for electricity data with bar graphs showing units and amounts for different categories and months.
    Add to Wishlist
    Download
    AI Customize
    KPI dashboard template with progress bars, pie chart, bar graphs, and workload metrics in a clean blue theme.
    Add to Wishlist
    Download
    AI Customize
    Dashboard slide showing business performance, including technology, accessibility, and security scores with activity graphs.
    Add to Wishlist
    Download
    AI Customize
    KPI dashboard slide featuring six charts vertical bars, horizontal bars, area graph, pie chart, and column bar graphs.
    Add to Wishlist
    Download
    AI Customize
    KPI dashboard highlighting supplier statistics using donut charts, order-to-invoice process, and bar charts.
    Free
    Add to Wishlist
    Download
    AI Customize
    Dashboard with four sections showing charts, icons, and metrics in purple, red, green, and teal.
    Free
    Add to Wishlist
    Download
    AI Customize
    A slide with a sleek dashboard design that includes colorful data visualizations like pie charts, graphs, and progress bars.
    Free
    Add to Wishlist
    Download
    AI Customize
    KPI dashboard with percentage stats, bar charts, and flow diagrams in red, blue, and orange representing data trends.