Best PowerPoint Dashboard Template Free Slide Design

Colorful dashboard PPT template featuring financial figures, text placeholders, and a radar chart for visual data analysis.
P.ID : 47703
    2.4K+ views
    213 Downloads
    Get Custom Slides by Experts
    Instantly Access Templates in PowerPoint

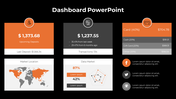
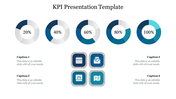
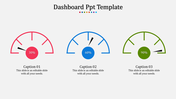
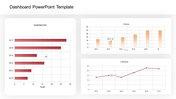
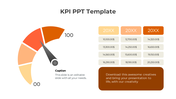
    Best Dashboard Template For Presentation

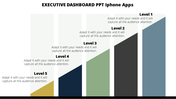
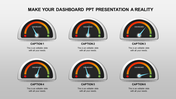
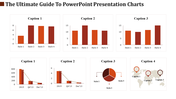
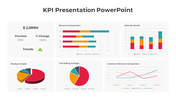
    We have the best hand-picked collection of Dashboard Templates to present your data. It is designed with statistical data, graphs, charts, and icons to represent the data. The design of this slide will be handy for you to showcase the vital data visually on a big screen. You can create an attractive presentation using this editable layout. This slide can be beneficial in monitoring your business activities. It is a handy tool to customize. Personalize this dashboard layout by changing its color tone, theme, font style, and backgrounds. Grab this free slide for no cost at SlideEgg.
     
    Features of the template 
    • 100% customizable slides and easy to download.
    • Slides are available in different nodes & colors.
    • The slide contained 16:9 and 4:3 formats.
    • Easy to change the slide colors quickly.
    • It is a well-crafted template with an instant download facility.
    • Mind-blowing slide for the PowerPoint.
    • Best presentation slide.
    • Highly compatible with PowerPoint, Google Slides and Canva template.
    Advertisement

    You May Also Like These PowerPoint Templates

    Add to Wishlist
    Download
    AI Customize
    Speedometer dashboard PowerPoint slides showing three colored gauges with 25, 50, and 75 percent progress with captions.
    Add to Wishlist
    Download
    AI Customize
    Dashboard PPT slide showcasing defect rates, supplier analysis, revenue breakdown, and delivery time analysis with charts.
    Add to Wishlist
    Download
    AI Customize
    KPI PowerPoint slide featuring three colored gauges for Revenue, Sales, and Sales Value with respective values.
    Add to Wishlist
    Download
    AI Customize
    KPI dashboard template with bar and line graphs showing private school growth for 2017, 2018, and 2019 with educational data.
    Free
    Add to Wishlist
    Download
    AI Customize
    Free KPI Presentation PPT Template and Google Slides
    Add to Wishlist
    Download
    AI Customize
    Executive Dashboard slide showing key performance metrics such as revenue vs. target, customer acquisition, and CAC vs. CLV.
    Free
    Add to Wishlist
    Download
    AI Customize
    Dashboard template with a circular speedometer gauge in the center, divided into five blue segments labeled 01 to 05.
    Free
    Add to Wishlist
    Download
    AI Customize
    Colorful project dashboard PPT slide showing a bar chart for four sections with a pie chart detailing percentages.
    Add to Wishlist
    Download
    AI Customize
    Slide with a revenue chart and metrics for daily, weekly, and yearly sales, along with three user graphs.
    Add to Wishlist
    Download
    AI Customize
    Data driven financial presentation slide featuring revenue, profit, and customer metrics, along with trend graphs.
    Free
    Add to Wishlist
    Download
    AI Customize
    KPI dashboard bar chart slide representing the height of the world's tallest hills with a world map marking their locations.
    Free
    Add to Wishlist
    Download
    AI Customize
    Dashboard infographic with three gauge meters in blue, green, and yellow, each labeled with a number and caption.
    Add to Wishlist
    Download
    AI Customize
    KPI dashboard slide with line chart, showing performance for four categories, along with circular percentage indicators.
    Add to Wishlist
    Download
    AI Customize
    Speedometer KPI dashboard showing speed readings for three vehicles a truck, a van, and a car.
    Add to Wishlist
    Download
    AI Customize
    KPI dashboard PowerPoint slide showing a bar chart with active accounts for different categories and percentage indicators.
    Add to Wishlist
    Download
    AI Customize
    Six panel infographic featuring KPI metrics with colorful charts, graphs, and numerical data insights.
    Add to Wishlist
    Download
    AI Customize
    Central speedometer style gauge with red, yellow, blue, and green sections, surrounded by numbered text boxes.