Optimize Executive Dashboard PPT And Google Slides Template

Executive dashboard slide featuring key financial metrics like sales, gross profit, and operating profit with visual charts.
P.ID : 3789
    1K+ views
    163 Downloads
    Get Custom Slides by Experts
    Instantly Access Templates in PowerPoint

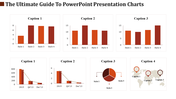
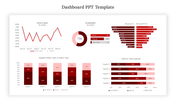
    Executive Dashboard PowerPoint Template


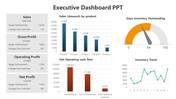
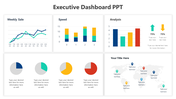
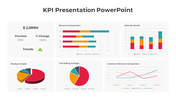
    Enhance decision-making with our Dashboard Template, tailored for businesses, analysts, and project managers. This template provides a comprehensive visual overview of crucial metrics and performance indicators. Effectively involve teams, stakeholders, and management by presenting a dynamic snapshot of real-time data. It's an excellent tool for monitoring project advancements, evaluating business performance, and making informed decisions based on data. Our executive Dashboard PPT Template is a contemporary, professional PowerPoint template crafted for versatile applications. It prioritizes clear data visualization through diverse charts and graphs. Elevate your presentations, streamline data analysis, and captivate your audience with our user-friendly Dashboard Template.  Download now and empower your leadership team to make informed decisions that drive success.


    Features of this template


    • 100% customizable slides and easy to download.
    • The slide contains 16:9 and 4:3 formats.
    • Easy to change the colors of the slide quickly.
    • Highly compatible with PowerPoint and Google Slides.
    Advertisement

    You May Also Like These PowerPoint Templates

    Add to Wishlist
    Download
    AI Customize
    KPI PowerPoint template with a gauge and table for displaying yearly financial data on a white backdrop.
    Add to Wishlist
    Download
    AI Customize
    Speedometer dashboard PowerPoint slides showing three colored gauges with 25, 50, and 75 percent progress with captions.
    Add to Wishlist
    Download
    AI Customize
    Dashboard PPT slide showcasing defect rates, supplier analysis, revenue breakdown, and delivery time analysis with charts.
    Add to Wishlist
    Download
    AI Customize
    KPI PowerPoint slide featuring three colored gauges for Revenue, Sales, and Sales Value with respective values.
    Add to Wishlist
    Download
    AI Customize
    KPI dashboard template with bar and line graphs showing private school growth for 2017, 2018, and 2019 with educational data.
    Free
    Add to Wishlist
    Download
    AI Customize
    Free KPI Presentation PPT Template and Google Slides
    Add to Wishlist
    Download
    AI Customize
    Executive Dashboard slide showing key performance metrics such as revenue vs. target, customer acquisition, and CAC vs. CLV.
    Free
    Add to Wishlist
    Download
    AI Customize
    Dashboard template with a circular speedometer gauge in the center, divided into five blue segments labeled 01 to 05.
    Free
    Add to Wishlist
    Download
    AI Customize
    Colorful project dashboard PPT slide showing a bar chart for four sections with a pie chart detailing percentages.
    Add to Wishlist
    Download
    AI Customize
    Central speedometer style gauge with red, yellow, blue, and green sections, surrounded by numbered text boxes.
    Add to Wishlist
    Download
    AI Customize
    KPI dashboard with a dual-line graph, balance performance gauge, and quarterly income metrics.
    Add to Wishlist
    Download
    AI Customize
    Business dashboard with progress indicators for promotion, channel management, and revenue metrics.
    Free
    Add to Wishlist
    Download
    AI Customize
    Colorful dashboard style meters PPT slide with captions and placeholder text.
    Free
    Add to Wishlist
    Download
    AI Customize
    Dashboard layout featuring a line graph, pie chart, net worth value, and categorized assets and liabilities in green theme.
    Free
    Add to Wishlist
    Download
    AI Customize
    Free KPI PPT Template For Presentation & Google Slides
    Free
    Add to Wishlist
    Download
    AI Customize
    KPI PPT Template with three colourful circular progress charts  showing percentages, growth indicators, and  bar charts.