Free - Magnificent PowerPoint Dashboard Templates Presentation

Free
Dashboard template with a circular speedometer gauge in the center, divided into five blue segments labeled 01 to 05.
P.ID : 35765
    641 views
    231 Downloads
    Get Custom Slides by Experts
    Instantly Access Templates in PowerPoint

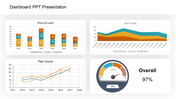
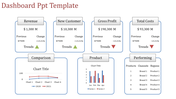
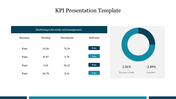
    Azure Dashboard Presentation Slides


    Elevate your data-driven presentations with our PowerPoint Dashboard Templates - Blue. These meticulously designed templates offer a unique blend of style and functionality, enabling you to create visually stunning and informative dashboards. With a clean and professional look, these templates provide a seamless platform for presenting complex data concisely and engagingly. Effortlessly track key metrics, analyze trends, and communicate insights with clarity. Impress your audience with attractive visualizations and empower decision-making through actionable data. 


    Features of the template

    • 100% customizable slides and easy to download.
    • Slides are available in different nodes & colors.
    • The slide contains 16:9 and 4:3 formats.
    • Easy to change the slide colors quickly.
    • Well-crafted template with an instant download facility. 
    • Access on both MS PowerPoint and Google Slides.
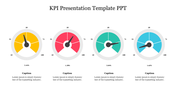
    • Five nodes in circular setup.
    Advertisement

    You May Also Like These PowerPoint Templates

    Free
    Add to Wishlist
    Download
    AI Customize
    Bar chart with five vertical bars representing data analysis with various high, low, and volume indicators displayed.
    Free
    Add to Wishlist
    Download
    AI Customize
    Colorful bar chart with three data categories and corresponding bars each with caption areas.
    Add to Wishlist
    Download
    AI Customize
    Three pie charts with segmented sections and percentage labels, each chart featuring placeholder text below.
    Add to Wishlist
    Download
    AI Customize
    A pie chart template with three circular charts representing each with text and icons beside them.
    Add to Wishlist
    Download
    AI Customize
    Area chart with a teal base and five markers in yellow, red, and maroon shades representing growth percentages.
    Add to Wishlist
    Download
    AI Customize
    Pie Chart PowerPoint with Segmented Circles Slides
    Add to Wishlist
    Download
    AI Customize
    Four segmented doughnut charts in yellow, red, purple, and blue with black circular labels, percentage values, and captions.
    Add to Wishlist
    Download
    AI Customize
    Illustration of a chart with yellow, red, and green horizontal bars displaying percentages and paper boat icons on waves.
    Add to Wishlist
    Download
    AI Customize
    A vertical green color bar chart slide displaying loss data from 2014 to 2019, with the title at the top.
    Free
    Add to Wishlist
    Download
    AI Customize
    Map-based analysis design with statistical data visuals including circular graphs and demographic distributions.
    Free
    Add to Wishlist
    Download
    AI Customize
    Gantt chart slide showing six tasks with progress bars, each reflecting completion levels ranging from 30% to 80%.
    Add to Wishlist
    Download
    AI Customize
    Four orange pie charts with center numbers from 01 to 04, each with text placeholders on the right.
    Add to Wishlist
    Download
    AI Customize
    Microsoft PowerPoint slide featuring three donut charts in yellow, orange, and pink, each with different percentage values.
    Add to Wishlist
    Download
    AI Customize
    Business chart with three line graphs representing data over four years, and yellow, red, and purple captions.
    Add to Wishlist
    Download
    AI Customize
    Horizontal Gantt chart with blue bars representing tasks, timeline from March to April 2020, and gray grid lines.
    Free
    Add to Wishlist
    Download
    AI Customize
    Line chart template with two data series on a dark background, featuring a calculator and pen in the background.