Multicolor Best PowerPoint Pie Chart Template Slides

Three pie charts with segmented sections and percentage labels, each chart featuring placeholder text below.
P.ID : 12777
    1.8K+ views
    169 Downloads
    Get Custom Slides by Experts
    Instantly Access Templates in PowerPoint

    Pie Chart Presentation Slide

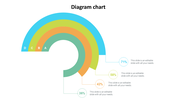
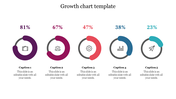
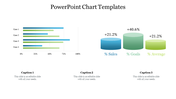
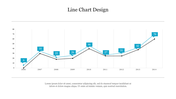
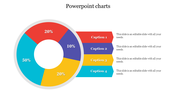
    Transform your data into a visually engaging story with some colorful pie charts. Pie charts are a powerful visual tool used to represent data in a circular format, allowing the viewer to quickly and easily analyze the relative sizes of different categories or data sets. These charts are useful for visually comparing data. Pie charts are also a great way to highlight trends or changes in data over time. By using our colorful presentation template, you can also create pie charts that effectively communicate your data to your audience.

    Features of the template

    • 100% customizable slides and easy to download.
    • Slides are available in different nodes & colors.
    • The slides contain 16:9 and 4:3 formats.
    • Easy to change the colors quickly.
    • It is a well-crafted template with an instant download facility.
    • It is a 100% pre-designed slide.
    • This slide is compatible with Google Slide Themes.
    • It has a creative design.
    Advertisement

    You May Also Like These PowerPoint Templates

    Free
    Add to Wishlist
    Download
    AI Customize
    Infographic with a circular segmented chart in blue shades, centered around an AI head graphic placed in white background.
    Add to Wishlist
    Download
    AI Customize
    Executive dashboard presentation slide with arrows and title placeholders on a notebook background.
    Add to Wishlist
    Download
    AI Customize
    PowerPoint pie chart template with three segments and associated icons.
    Add to Wishlist
    Download
    AI Customize
    Three vertical rectangular sections with headers in green, blue, and orange, each with captions inside.
    Add to Wishlist
    Download
    AI Customize
    Colorful pie chart PowerPoint slide with five labeled sections and captions on a white backdrop.
    Free
    Add to Wishlist
    Download
    AI Customize
    Pie chart slide with a blue and dark blue donut chart showing 75% sales, two numbered text boxes on the right.
    Add to Wishlist
    Download
    AI Customize
    Executive dashboard slide with a gauge displaying performance across different levels, labeled three sections.
    Free
    Add to Wishlist
    Download
    AI Customize
    Green and black area chart with a star shaped yellow badge and four circular icons with text below.
    Add to Wishlist
    Download
    AI Customize
    Marketing KPI template with three circular icons, and bar and line charts in blue, gray, and green below.
    Free
    Add to Wishlist
    Download
    AI Customize
    Creative infographic with a curved orange graph divided into four steps, each with an icon and label.
    Add to Wishlist
    Download
    AI Customize
    Bar chart with green hues, showing data for six categories, with side status boxes and light text.
    Add to Wishlist
    Download
    AI Customize
    Creative PowerPoint slide with two lines on a chart yellow and red with a green dot marking the highest point on the line.
    Free
    Add to Wishlist
    Download
    AI Customize
    Three column layout with blue megaphone, orange lightbulb, and red envelope icons on a beige background.
    Add to Wishlist
    Download
    AI Customize
    3D triangular bar chart in yellow, orange, and blue shades showing monthly data for four categories, on a dark background.
    Free
    Add to Wishlist
    Download
    AI Customize
    A simple chart slide with overlaid blue, green, orange, and yellow circles of varying sizes with a graph and captions.
    Add to Wishlist
    Download
    AI Customize
    Gantt chart PowerPoint template showing a timeline for multiple targets across January, February, and March, with milestones.