Best Infographic Chart PowerPoint And Google Slides

Pack of 20 slides
P.ID : 35093
Advertisement
1.7K+ views
198 Downloads
Get Custom Slides by Experts
Instantly Access Templates in PowerPoint

Infographic Chart Presentation Slides


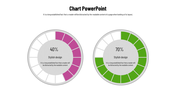
Unleash the power of data with our mesmerizing Infographic Chart PowerPoint templates. Step into a world where numbers transcend the mundane and change into eye-catchy visual symphonies. With a harmonious blend of aesthetics and information, our templates breathe life into your data, revealing hidden patterns and insights.

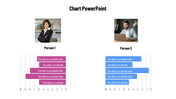
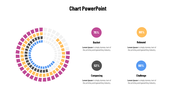
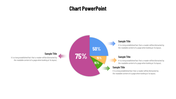
From sleek bar graphs to elegant pie charts, each element is meticulously designed to captivate your audience's imagination. Let your presentations become an immersive journey, where information dances, and concepts come alive. Experience the magic of our Infographic Chart PowerPoint templates and chart a new path to storytelling.

Features of this templates


  • 100% customizable slides and easy to download.
  • The slide contains 16:9 and 4:3 formats.
  • Easy to change the colors of the slide quickly.
  • Highly compatible with PowerPoint and Google Slides.

You May Also Like These PowerPoint Templates

Add to Wishlist
Download
AI Customize
Visual KPI layout with performance bar chart, doughnut chart, and percentage indicators for project analysis.
Add to Wishlist
Download
AI Customize
Three pie charts in brown, blue, and green sections, each with labeled percentages and caption lines.
Free
Add to Wishlist
Download
AI Customize
Multicolored circular pie chart in yellow, red, and green, with labeled categories listed on the right.
Free
Add to Wishlist
Download
AI Customize
Bar chart with five vertical bars representing data analysis with various high, low, and volume indicators displayed.
Add to Wishlist
Download
AI Customize
A monthly PowerPoint template displaying colorful wave like graphs for each month from January to June with placeholder text.
Free
Add to Wishlist
Download
AI Customize
Colorful bar chart with three data categories and corresponding bars each with caption areas.
Add to Wishlist
Download
AI Customize
Three pie charts with segmented sections and percentage labels, each chart featuring placeholder text below.
Add to Wishlist
Download
AI Customize
A pie chart template with three circular charts representing each with text and icons beside them.
Add to Wishlist
Download
AI Customize
Area chart with a teal base and five markers in yellow, red, and maroon shades representing growth percentages.
Add to Wishlist
Download
AI Customize
Pie Chart PowerPoint with Segmented Circles Slides
Add to Wishlist
Download
AI Customize
Four segmented doughnut charts in yellow, red, purple, and blue with black circular labels, percentage values, and captions.
Add to Wishlist
Download
AI Customize
Illustration of a chart with yellow, red, and green horizontal bars displaying percentages and paper boat icons on waves.
Add to Wishlist
Download
AI Customize
A vertical green color bar chart slide displaying loss data from 2014 to 2019, with the title at the top.
Free
Add to Wishlist
Download
AI Customize
Map-based analysis design with statistical data visuals including circular graphs and demographic distributions.
Free
Add to Wishlist
Download
AI Customize
Gantt chart slide showing six tasks with progress bars, each reflecting completion levels ranging from 30% to 80%.
Add to Wishlist
Download
AI Customize
Annual report slide with five sections of pie chart, bar graphs, and profit figures, in green and blue tones.
Add to Wishlist
Download
AI Customize
Four orange pie charts with center numbers from 01 to 04, each with text placeholders on the right.
Add to Wishlist
Download
AI Customize
Microsoft PowerPoint slide featuring three donut charts in yellow, orange, and pink, each with different percentage values.
Add to Wishlist
Download
AI Customize
Business chart with three line graphs representing data over four years, and yellow, red, and purple captions.
Add to Wishlist
Download
AI Customize
Horizontal Gantt chart with blue bars representing tasks, timeline from March to April 2020, and gray grid lines.
Free
Add to Wishlist
Download
AI Customize
Line chart template with two data series on a dark background, featuring a calculator and pen in the background.
Add to Wishlist
Download
AI Customize
Colorful progress bars in rows, showing numbered squares in red, teal, purple, and blue, with text on the right.
Add to Wishlist
Download
AI Customize
Professional setting with pie charts showing task distribution in red tones for analysis, collection, and development.
Add to Wishlist
Download
AI Customize
Gradient peaks showing sales growth percentages in shades of blue and gray, with detailed text on the right dark sidebar.
Add to Wishlist
Download
AI Customize
Slide featuring a blue-toned pie chart representing sales revenue percentages, with captions areas for each segment.
Add to Wishlist
Download
AI Customize
Row of pie charts with varying color schemes for data visualization each place diwth caption areas.
Add to Wishlist
Download
AI Customize
Dashboard chart displaying social media subscribers by gender, age, most read articles, and categories in 2019.
Add to Wishlist
Download
AI Customize
Three pie charts in red, yellow, and blue with percentage values, arranged horizontally with text below.
Add to Wishlist
Download
AI Customize
Six-month Gantt chart template spanning July to December 2020 with weekly divisions and task rows.
Add to Wishlist
Download
AI Customize
Five segment pie chart in orange, blue, red, green, and pink, each with number and connected with text areas.