Attractive Free PowerPoint Templates Charts And Diagrams

Colorful pie chart with four segments in blue, purple, red, and orange, with matching text boxes showing percentages.
P.ID : 46781
    1.4K+ views
    195 Downloads
    Get Custom Slides by Experts
    Instantly Access Templates in PowerPoint

    Innovative Chart and Diagram Template Presentation

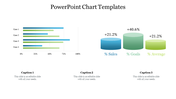
    Download these Free PowerPoint Templates, Charts, and Diagrams for your slideshow. It is a 100% editable template. You can use this prolific template to provide well enough information for the visitors.

    About the template:

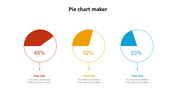
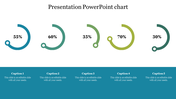
    Free PowerPoint Templates, Charts, and Diagrams are created to capture your visitors' attention and imagination. This slide template has a pie chart model with multi-color features. The caption area can be easily edited to add your statistical data. You can use the template for business, sales, and other workspace presentations. The template makes you understand easily even the unfamiliar concepts to your audiences. The white background will take advantage of making your slide show look more contrast.

    Features of this Template:

    • Brilliant innovative template designs 
    • 100% editable and customizable slide
    • Slides are available in different themes
    • Use appealing slide themes in a different way 
    • User-friendly slide template models
    • The attractive design adds credits to your presentation
    Advertisement

    You May Also Like These PowerPoint Templates

    Add to Wishlist
    Download
    AI Customize
    Donut chart with four colorful quadrants and text placeholders, connected by lines to circular percentage labels around it.
    Add to Wishlist
    Download
    AI Customize
    Four orange pie charts with center numbers from 01 to 04, each with text placeholders on the right.
    Free
    Add to Wishlist
    Download
    AI Customize
    Line chart showing traction growth with two labeled data points in green and blue, alongside thumbs up and thumbs down icons.
    Free
    Add to Wishlist
    Download
    AI Customize
    Line chart template with two data series on a dark background, featuring a calculator and pen in the background.
    Add to Wishlist
    Download
    AI Customize
    Professional setting with pie charts showing task distribution in red tones for analysis, collection, and development.
    Add to Wishlist
    Download
    AI Customize
    Gradient peaks showing sales growth percentages in shades of blue and gray, with detailed text on the right dark sidebar.
    Add to Wishlist
    Download
    AI Customize
    Dashboard chart displaying social media subscribers by gender, age, most read articles, and categories in 2019.
    Free
    Add to Wishlist
    Download
    AI Customize
    Line chart in teal showing data points from 2013 to 2020 on a white background, with five icons listed on the right.
    Free
    Add to Wishlist
    Download
    AI Customize
    Histogram on the left and Pareto chart in pink and orange with cumulative line on the right.
    Free
    Add to Wishlist
    Download
    AI Customize
    Four blue pyramid shapes in ascending size, labeled with percentages, aligned over a horizontal gray bar.
    Add to Wishlist
    Download
    AI Customize
    Slide with two donut charts displaying values and a text section on the right with a blurred background image.
    Add to Wishlist
    Download
    AI Customize
    Stacked column chart template displaying proportional data distribution across four categories using three series.
    Add to Wishlist
    Download
    AI Customize
    Colorful circular diagram slide illustrating four corporate strategy methods with labels and percentages.
    Add to Wishlist
    Download
    AI Customize
    KWL chart with sections  in blue, green, and red, each column containing placeholder text.
    Add to Wishlist
    Download
    AI Customize
    Dashboard with four bar charts in yellow, green, teal, and red, comparing project risks and change requests.
    Add to Wishlist
    Download
    AI Customize
    Slide with pie charts, line graphs, and a bar chart in shades of green, illustrating data trends and comparisons.
    Free
    Add to Wishlist
    Download
    AI Customize
    Infographic of a bar chart representing yearly growth from 2018 to 2021 with a businesswoman illustration.
    Add to Wishlist
    Download
    AI Customize
    Innovative KWL Chart PowerPoint Presentation Slide