Free - KWL Chart PowerPoint Template For Presentation
Free


Free Chevron Model Slide To Present The KWL Chart
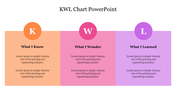
Know, Want-to-know, Learned. Are you trying to discuss these reading strategies with your audience in a creative way? Then don't go anywhere. SlideEgg offers you this simple yet creative presentation slide to achieve your goal. As it is professionally well-designed, it will be easy for you to present the KWL chart in an effective manner.
About the template
It is a free slide with premium quality designs. It has three nodes with chevrons and text boxes to present what I know, what I want to know, and what I learned concepts. The blue colors of this slide make it visually engaging. The simplicity of this slide will help your audience to easily follow the content you are presenting. You can also find more best business slides from SlideEgg. Try Today!
Features of the template
- 100% customizable slides and easy to download.
- Slides are available in different nodes & colors.
- The slide contained 16:9 and 4:3 formats.
- Easy to change the slide colors quickly.
- Well-crafted template with instant download facility.
- Creative slide with simple graphics.
- Free slide with premium quality.


You May Also Like These PowerPoint Templates
Add to Wishlist
Download
Edit

Add to Wishlist
Download
Edit

Add to Wishlist
Download
Edit


Add to Wishlist
Download
Edit

Add to Wishlist
Download
Edit

Add to Wishlist
Download
Edit

Add to Wishlist
Download
Edit


Add to Wishlist
Download
Edit


Add to Wishlist
Download
Edit

Add to Wishlist
Download
Edit

Add to Wishlist
Download
Edit

Add to Wishlist
Download
Edit

Add to Wishlist
Download
Edit

Add to Wishlist
Download
Edit

Add to Wishlist
Download
Edit

Add to Wishlist
Download
Edit

Add to Wishlist
Download
Edit
