Multi - Chart PowerPoint Template and Google Slides

PowerPoint slide showcasing a chart with project status trends and a progress bar for each year.
P.ID : 4101
    433 views
    30 Downloads
    Get Custom Slides by Experts
    Instantly Access Templates in PowerPoint

    Multi - Chart PowerPoint Template and Google Slides


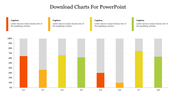
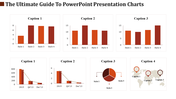
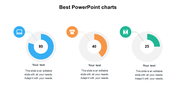
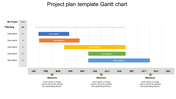
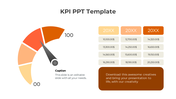
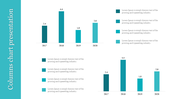
    Enhance your project presentations with our Chart PowerPoint Template and Google Slides. This template is designed to showcase the growth and progress of your projects through visually appealing charts, graphs, and percentages. 

    Featuring ample space for text, the template allows you to provide detailed explanations and insights alongside your visual data. It's fully editable, enabling you to customize the charts and graphs to suit your specific project needs.

    Utilize this template to effectively communicate project milestones, achievements, and projections to your audience. Whether you're presenting to stakeholders, clients, or team members, our Chart PowerPoint Template and Google Slides will help you deliver impactful presentations that highlight the success and trajectory of your projects.

    Features of the template

    • 100% customizable slides and easy to download.
    • Slides are available in different nodes & colors.
    • The slide contains 16:9 and 4:3 formats.
    • It is easy to change the colors of the slide quickly. 
    • Well-crafted template with an instant download facility.
    Advertisement

    You May Also Like These PowerPoint Templates

    Add to Wishlist
    Download
    AI Customize
    Dashboard PPT slide showcasing defect rates, supplier analysis, revenue breakdown, and delivery time analysis with charts.
    Add to Wishlist
    Download
    AI Customize
    KPI PowerPoint slide featuring three colored gauges for Revenue, Sales, and Sales Value with respective values.
    Add to Wishlist
    Download
    AI Customize
    Two vertical bar charts with three columns each, alongside captions with percentages in varying shades of orange.
    Add to Wishlist
    Download
    AI Customize
    KPI dashboard template with bar and line graphs showing private school growth for 2017, 2018, and 2019 with educational data.
    Free
    Add to Wishlist
    Download
    AI Customize
    Free KPI Presentation PPT Template and Google Slides
    Free
    Add to Wishlist
    Download
    AI Customize
    Revenue analysis slide with bar chart, financial icon, and two descriptive sections for customer metrics.
    Add to Wishlist
    Download
    AI Customize
    3D pie chart with four color-coded segments red, orange, yellow, and brown displaying percentage values.
    Add to Wishlist
    Download
    AI Customize
    PPT template for an annual report featuring a bar graph comparing data across three time periods with color coded categories.
    Free
    Add to Wishlist
    Download
    AI Customize
    Bar chart slide with three stacked bars, each divided into segments with percentage labels, and a table on the right.
    Add to Wishlist
    Download
    AI Customize
    Gantt chart layout with five vertical milestone markers in blue, black, brown, green, and yellow.
    Free
    Add to Wishlist
    Download
    AI Customize
    3D bar graph with six green bars of varying heights, labeled placeholders, and a gray sidebar with text blocks.
    Free
    Add to Wishlist
    Download
    AI Customize
    Slide with four green donut charts and two horizontal bar graphs showing data comparisons across quarters and months.
    Free
    Add to Wishlist
    Download
    AI Customize
    Illustration of six red bars with corresponding percentages and a businesswoman standing beside them.
    Add to Wishlist
    Download
    AI Customize
    Company annual report slide with a gray and red graph displaying data with percentage values for investment and profit.
    Free
    Add to Wishlist
    Download
    AI Customize
    Dashboard template with a circular speedometer gauge in the center, divided into five blue segments labeled 01 to 05.
    Add to Wishlist
    Download
    AI Customize
    Stacked bar chart with four vertical bars showing percentages from 2013, 2014, and 2015 in varying green shades.
    Add to Wishlist
    Download
    AI Customize
    Project timeline Gantt chart with color coded bars indicating task descriptions, assigned resources, and milestone markers.
    Add to Wishlist
    Download
    AI Customize
    PPT slide displaying various charts including bar charts, pie charts, calendars, and Gantt charts for project tracking.
    Free
    Add to Wishlist
    Download
    AI Customize
    KPI dashboard bar chart slide representing the height of the world's tallest hills with a world map marking their locations.
    Free
    Add to Wishlist
    Download
    AI Customize
    Dashboard infographic with three gauge meters in blue, green, and yellow, each labeled with a number and caption.