Best PowerPoint charts templates

PowerPoint chart template displaying three donut charts with percentages and icons representing data categories.
P.ID : 47647
    588 views
    108 Downloads
    Get Custom Slides by Experts
    Instantly Access Templates in PowerPoint

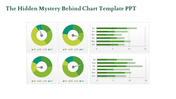
    Practical Chart Template with Three Nodes

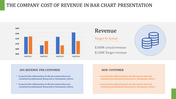
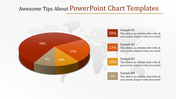
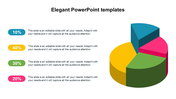
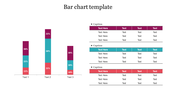
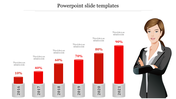
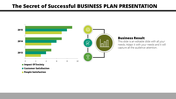
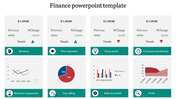
    When you want to discuss your business data in a chart, you need a perfect chart to analyze the different perspectives and specific competencies to achieve your business goal. Discuss your business data or any other by using our best Chart PowerPoint Template. The three pie charts with different shades in this slide give a visual impact. Also, each chart has an icon and percentage level to present complex details understandably. Tell your strategy with this visually attracted slide to engage your audience.

    Features of the Template

    • 100 % customizable slides and easy to download
    • Slides are available in different nodes & colors.
    • This PowerPoint has three nodes.
    • The slide contained 16:9 and 4:3 formats.
    • Easy to change the slide colors quickly.
    • It is a well-crafted template with an instant download facility.
    • It is designed with a stunning theme design.
    • It comes in a pie chart theme.
    Advertisement

    You May Also Like These PowerPoint Templates

    Add to Wishlist
    Download
    AI Customize
    PPT slide displaying various charts including bar charts, pie charts, calendars, and Gantt charts for project tracking.
    Free
    Add to Wishlist
    Download
    AI Customize
    KPI dashboard bar chart slide representing the height of the world's tallest hills with a world map marking their locations.
    Free
    Add to Wishlist
    Download
    AI Customize
    Dashboard infographic with three gauge meters in blue, green, and yellow, each labeled with a number and caption.
    Add to Wishlist
    Download
    AI Customize
    KPI dashboard slide with line chart, showing performance for four categories, along with circular percentage indicators.
    Add to Wishlist
    Download
    AI Customize
    Speedometer KPI dashboard showing speed readings for three vehicles a truck, a van, and a car.
    Free
    Add to Wishlist
    Download
    AI Customize
    Visual layout of various charts, including area and bar graphs, arranged in a grid format with caption areas.
    Add to Wishlist
    Download
    AI Customize
    KPI dashboard PowerPoint slide showing a bar chart with active accounts for different categories and percentage indicators.
    Add to Wishlist
    Download
    AI Customize
    Template showcasing various chart designs, including line, bar, pie, and comparison charts across multiple slides.
    Add to Wishlist
    Download
    AI Customize
    Six panel infographic featuring KPI metrics with colorful charts, graphs, and numerical data insights.
    Add to Wishlist
    Download
    AI Customize
    Creative charts showing a circular 60% approval metric, bar graphs, and a 55% Twitter engagement donut chart.
    Free
    Add to Wishlist
    Download
    AI Customize
    PPT slide with a yellow bar chart showing percentages for the years 2016 to 2021 with a woman standing next to the chart.
    Free
    Add to Wishlist
    Download
    AI Customize
    Gantt chart plan template showing tasks across months with a colorful circular pie chart and matching bars on theright.
    Add to Wishlist
    Download
    AI Customize
    Financial highlights slide with bar chart and circular gauges tracking sales, operating income, and expenses.
    Free
    Add to Wishlist
    Download
    AI Customize
    Bar chart comparing metrics over years alongside a diagram linking manager, idea, and management to business growth.
    Add to Wishlist
    Download
    AI Customize
    Project schedule slide with a Gantt chart displaying tasks, timelines, and completion percentages.
    Free
    Add to Wishlist
    Download
    AI Customize
    Dashboard with line graphs, a circular chart with three segments, and labeled financial metrics, in red, orange, and green.
    Add to Wishlist
    Download
    AI Customize
    Dashboard slide showing Zantedeschia, Celosia, and Calendula growth data with a bar chart from 2012 to 2017.
    Add to Wishlist
    Download
    AI Customize
    A dashboard style slide showing plant growth data for Zantedeschia, Celosia, and Calendula with gauge charts and a bar graph.
    Free
    Add to Wishlist
    Download
    AI Customize
    Comparison of revenue and cost distributions with pie charts displaying CAPEX and OPEX percentages.