Easy To Edit Chart PowerPoint Presentation Templates

3D pie chart with four color-coded segments red, orange, yellow, and brown displaying percentage values.
P.ID : 8964
    696 views
    116 Downloads
    Get Custom Slides by Experts
    Instantly Access Templates in PowerPoint

    Effortless Chart Editing PowerPoint Templates


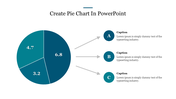
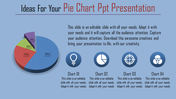
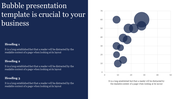
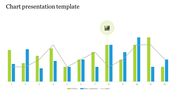
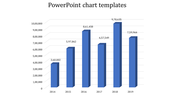
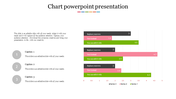
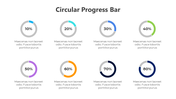
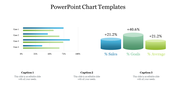
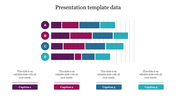
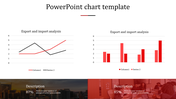
    Hello! Need to present your data in a clear and engaging way? Our Easy to Edit Chart PowerPoint Presentation Templates are here to help. With a vibrant multi-color theme and featuring a world map and pie chart icon, these templates are designed for business professionals who value clarity and style. The four nodes make it simple to break down complex data into digestible visuals. Perfect for global data presentations, these templates are user-friendly and fully customizable, ensuring you can tweak every detail to fit your needs. Whether you’re sharing sales statistics, market analysis, or project progress, these templates turn data into eye-catching visuals that are easy to understand. Bring your data to life with our Easy to Edit Chart Templates and make every presentation a success!


    Features of this template:

    • 100% customizable slides and easy to download.
    • Slides available in different nodes & colors.
    • The slide contained 16:9 and 4:3 format.
    • Easy to change the slide colors quickly.
    • Well-crafted template with instant download facility.

    Advertisement

    You May Also Like These PowerPoint Templates

    Free
    Add to Wishlist
    Download
    AI Customize
    Purple bar chart PPT slide with years 2018 to 2021 and percentages and a businesswoman presenting the information.
    Free
    Add to Wishlist
    Download
    AI Customize
    Layered area chart with Series 1 in yellow, Series 2 in orange, and Series 3 in black, showing data trends over time.
    Add to Wishlist
    Download
    AI Customize
    Clustered bar chart comparing data across quarters with horizontal bars in various colors.
    Add to Wishlist
    Download
    AI Customize
    Slide with three vertical boxes in blue, red, and green banners, and rounded icons labeled K, W, and L for learning stages.
    Add to Wishlist
    Download
    AI Customize
    PowerPoint chart template showing stacked bar graphs with different categories and values for each year from 2016 to 2019.
    Add to Wishlist
    Download
    AI Customize
    Line graph infographic showing data from 2015 to 2020, with three colored lines in purple, yellow, and green, and text.
    Add to Wishlist
    Download
    AI Customize
    Donut chart in blue and orange displaying percentage, with matching colored caption boxes on either side.
    Add to Wishlist
    Download
    AI Customize
    Our Predesigned Chart Templates PPT Slides Designs
    Add to Wishlist
    Download
    AI Customize
    KWL chart slide with three columns in blue, red, and gold, representing learning insights.
    Add to Wishlist
    Download
    AI Customize
    Infographic with four bar graphs, each showing data points A to D, and captions areas in green boxes.
    Free
    Add to Wishlist
    Download
    AI Customize
    PowerPoint presentation slide featuring a stacked bar chart, aerial landscape photo, and a comparison table of drone data.
    Free
    Add to Wishlist
    Download
    AI Customize
    PowerPoint slide with a circular pie chart showing four segments labeled with percentages and a placeholder text.
    Add to Wishlist
    Download
    AI Customize
    Customized Kubler Ross PowerPoint Presentation Template
    Add to Wishlist
    Download
    AI Customize
    Visual of boost engagement growth with stacked bar categories: newsletter sign-ups, premium customers, and followers.
    Add to Wishlist
    Download
    AI Customize
    Pie charts showing data percentages for growth, with three percentage values with placeholder text.
    Add to Wishlist
    Download
    AI Customize
    A medical themed PowerPoint slide with three colorful circular progress bars showing percentages, each with related icons.
    Free
    Add to Wishlist
    Download
    AI Customize
    Chart infographic with four drop shaped gauge style meters in blue, green, yellow, and red, each with text below.