Innovative KWL Chart Presentation Slide Template Design

Three outlined boxes in yellow, red, and green, each with circles labeled K, W, and L, at the bottom.
P.ID : 65577
    410 views
    67 Downloads
    Get Custom Slides by Experts
    Instantly Access Templates in PowerPoint

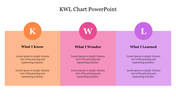
    Three Noded Innovative KWL Chart PPT Slide

    Trying to make a perfect presentation to communicate the KWL framework? It is time to download this KWL Chart Presentation Slide from Slide Egg! We offer this well-designed, creative slide to help you design a captivating and informative presentation. It is also fully editable according to your needs. Download Now!

    About the template:

    The KWL Chart Presentation Slide has three creatively designed text boxes. It has wonderful designs in eye-catching colors. It includes multi color circles with the letters K, W, L. The white background and simple graphics of this slide will give an elegant look to your presentations. Using our KWL Chart PowerPoint Templates is an excellent way to make your presentations stand out. 

    Features of this template:

    1. 100% customizable slides and easy to download.
    2. Slides available in different nodes & colors.
    3. The slide contained 16:9 and 4:3 formats.
    4. Easy to change the slide colors quickly.
    5. Well-crafted template with instant download facility.
    6. It has simple yet stunning graphics. 
    Advertisement

    You May Also Like These PowerPoint Templates

    Free
    Add to Wishlist
    Download
    AI Customize
    Horizontal bar chart with green and gray bars of varying lengths, labeled with placeholder text, on a light background.
    Add to Wishlist
    Download
    AI Customize
    Four pencil-shaped bars for education in orange, blue, red, and green representing data from 2011 to 2014 with values.
    Add to Wishlist
    Download
    AI Customize
    KPI dashboard slide with metrics for Visits, Visitors, Conversion rate, and Revenue per user along with views per device.
    Free
    Add to Wishlist
    Download
    AI Customize
    Bar chart with four vertical colored columns in green, blue, yellow, and red, with gray tops and captions above.
    Add to Wishlist
    Download
    AI Customize
    Green themed chart layout featuring bar graphs, pie charts, line graphs, and a world map for diverse data visualization.
    Add to Wishlist
    Download
    AI Customize
    Bar chart in PowerPoint displaying data with titles and placeholders for example text and additional information.
    Add to Wishlist
    Download
    AI Customize
    Chart slide showing monthly bar graphs split into two sections and pie charts highlighting four color-coded items.
    Add to Wishlist
    Download
    AI Customize
    Executive dashboard with four blue horizontal boxes containing text and a smiling cartoon man gesturing on the right.
    Add to Wishlist
    Download
    AI Customize
    Dashboard with a multi-colored semicircular gauge divided into four sections, labeled 01 to 04, and captions on the right.
    Add to Wishlist
    Download
    AI Customize
    Timeline chart slide displaying key dates and durations from July 2018 to October 2021 with placeholder text.
    Add to Wishlist
    Download
    AI Customize
    Business analysis dashboard with a bar chart and an illustrated man holding a pointer in a dark background.
    Add to Wishlist
    Download
    AI Customize
    PowerPoint Chart Template And Google Slides-Three Node
    Free
    Add to Wishlist
    Download
    AI Customize
    Four cylindrical blue bars in a row next to a woman in a black suit in a simple design layout.
    Add to Wishlist
    Download
    AI Customize
    Dashboard slide with a speedometer gauge in red, blue, yellow, and teal, and text bullet points on the left.
    Add to Wishlist
    Download
    AI Customize
    Green themed diagram illustrating stages of analysis delivery, from data source to client reports and dashboards.
    Add to Wishlist
    Download
    AI Customize
    A slide showcasing four different chart types from Column Histogram to Scatter Plot with corresponding data.
    Free
    Add to Wishlist
    Download
    AI Customize
    Green bar chart PowerPoint slide with percentages for the years 2017 through 2021 and a woman standing next to the chart.
    Add to Wishlist
    Download
    AI Customize
    Project summary dashboard showing project statistics, budget, actual performance, and project performance by category.