Free - KWL Chart PowerPoint Presentation and Google Slides Themes

Free
Pack of 11 slides
P.ID : 65552
Advertisement
1K+ views
358 Downloads
Get Custom Slides by Experts
Instantly Access Templates in PowerPoint

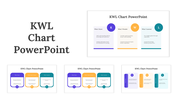
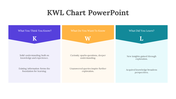
Free Three Noded KWL Chart PPT Slide 

Download this Free KWL Chart PowerPoint Presentation Template from Slide Egg to make a powerful presentation without breaking the bank. It is a powerful tool to use in presenting your presentation in a visually appealing way. The text boxes and colors are fully editable, and you can also adjust their sizes, colors, and layouts according to your needs.  

About the template:

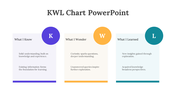
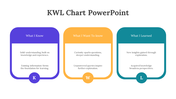
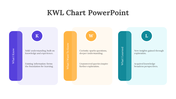
The Free KWL Chart PowerPoint Presentation Template includes three text holders with multi color circles. The circles have the letters K, W, and L. It enables you to present your notes inside the text box info graphics. It helps to present what I know, what I wonder, and what I learned. You can find more KWL Chart PPT Slides on our site.

Features of this template:

1. 100% customizable slides and easy to download.
2. Slides available in different nodes & colors.
3. The slide contained 16:9 and 4:3 formats.
4. Easy to change the slide colors quickly.
5. Well-crafted template with instant download facility.
6. It has a simple layout with text boxes.

You May Also Like These PowerPoint Templates

Add to Wishlist
Download
AI Customize
Stacked column chart template displaying proportional data distribution across four categories using three series.
Add to Wishlist
Download
AI Customize
Colorful circular diagram slide illustrating four corporate strategy methods with labels and percentages.
Add to Wishlist
Download
AI Customize
KWL chart with sections  in blue, green, and red, each column containing placeholder text.
Add to Wishlist
Download
AI Customize
Dark themed layout featuring four pie charts with shaded segments, each displaying different percentages.
Add to Wishlist
Download
AI Customize
Cash flow dashboard with a vertical bar chart and two horizontal stacked bar charts detailing revenue categories.
Add to Wishlist
Download
AI Customize
Dashboard with four bar charts in yellow, green, teal, and red, comparing project risks and change requests.
Add to Wishlist
Download
AI Customize
Project Gantt chart with task descriptions, percentage completion, and horizontal progress bars.
Add to Wishlist
Download
AI Customize
Three circular dashboard dials with red, blue, and brown segments, each containing captions below.
Add to Wishlist
Download
AI Customize
Slide featuring a dashboard with three dials labeled Low, Mid, and High, indicating various levels of measurement.
Add to Wishlist
Download
AI Customize
Slide with pie charts, line graphs, and a bar chart in shades of green, illustrating data trends and comparisons.
Free
Add to Wishlist
Download
AI Customize
PowerPoint slide showcasing projected cash flows, NPV for 3 and 5 years, and payback period with client testimonial.
Add to Wishlist
Download
AI Customize
Six month Gantt chart with bars in blue, green, red, orange, and teal, arranged for task tracking.
Free
Add to Wishlist
Download
AI Customize
Infographic of a bar chart representing yearly growth from 2018 to 2021 with a businesswoman illustration.
Add to Wishlist
Download
AI Customize
Circular pie chart divided into five colored sections noted with percentages, with corresponding boxes for text area.
Add to Wishlist
Download
AI Customize
Three panel dashboard with column, bar, and funnel charts at the top and numbered blue boxes with text below.
Free
Add to Wishlist
Download
AI Customize
KPI dashboard layout with blue semicircle gauges and line charts representing social media performance metrics.
Add to Wishlist
Download
AI Customize
Dashboard-themed slide with semi-circle charts for business analysis, featuring metrics and reflective silhouettes at the bottom.
Add to Wishlist
Download
AI Customize
Bar chart infographic with four blue bars for kpi forecasts, a line graph overlay, and a man with a magnifying glass.
Add to Wishlist
Download
AI Customize
Executive dashboard slide featuring bar graphs and pie charts comparing project data over three years, with text boxes.
Add to Wishlist
Download
AI Customize
Semi circular gauge in shades of brown and peach with a pointer, alongside text and a silhouette group at the bottom.
Free
Add to Wishlist
Download
AI Customize
An executive dashboard showing income and expense distribution, with key financial metrics and a line graph.
Add to Wishlist
Download
AI Customize
Slide with blue stats on the left and various charts, including bar and pie charts in different colors.
Add to Wishlist
Download
AI Customize
Comprehensive project dashboard template with progress charts, data bars, and financial performance indicators.
Add to Wishlist
Download
AI Customize
KPI Dashboard slide displaying metrics with bar charts and line graphs for key business indicators.
Free
Add to Wishlist
Download
AI Customize
Five step process chart with titled segments in shades of purple, showing stages and supporting information.
Add to Wishlist
Download
AI Customize
Innovative KWL Chart PowerPoint Presentation Slide
Add to Wishlist
Download
AI Customize
Analysis report template featuring a purple and green area graph comparing five projects, with separate information
Add to Wishlist
Download
AI Customize
Area chart with overlapping blue, teal, and green sections, timeline on the axis, and three labeled boxes below.