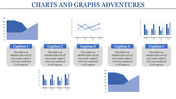
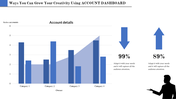
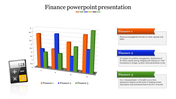
Free PPT Diagrams And Charts Download For Presentation

Colorful pie chart PowerPoint slide with five labeled sections and captions on a white backdrop.
P.ID : 46088
    167 views
    18 Downloads
    Get Custom Slides by Experts
    Instantly Access Templates in PowerPoint

    Stunning Pie Chart PPT Template

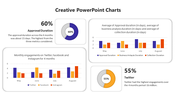
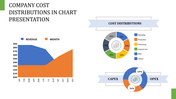
    One sort of graph that illustrates the information in the circular graph is a pie chart. It is a sort of graphical representation of data where the pie slices depict the data's relative sizes. The donut pie chart is the best option if you're searching for a data-efficient graph that can expand to run numerous analyses simultaneously. You can select our multicolored five-noded pie chart to best meet your needs while displaying data for your business. It is simple to change to include more information and customize it to the requirements of the business. Do this to make your Presentation more effective.

    Features of this Template 

    • 100 % customizable slides and easy to download.
    • Slides are available in different colors.
    • The slide has 4:3 and 16:9 formats.
    • Easy to change the slide colors quickly.
    • Appealing Presentation to impress an audience.
    • Create feature-rich slide presentations. 
    • An eye-pleasing color slide helps to give a catchy presentation.
    • Crisp and clear font styles and designed Presentation.
    • Multicolored attractive Pie Chart PPT.
    Advertisement

    You May Also Like These PowerPoint Templates

    Free
    Add to Wishlist
    Download
    AI Customize
    Four vertical orange columns and percentages, labeled by year, along with a businesswoman illustration on the right.
    Add to Wishlist
    Download
    AI Customize
    Botanical data dashboard template  showing performance metrics for flower species, featuring line and bar charts.
    Add to Wishlist
    Download
    AI Customize
    PowerPoint slide with multiple chart types, including bar, line, and pie charts with different styles.
    Free
    Add to Wishlist
    Download
    AI Customize
    Chart with colorful bars representing yearly data from 2013 to 2020, paired with eight colorful cube icons on the sides.
    Add to Wishlist
    Download
    AI Customize
    Gantt chart PPT slide displaying tasks with start and end dates, milestones, and progress tracking for each month.
    Add to Wishlist
    Download
    AI Customize
    KPI dashboard featuring a funnel chart, audience metrics, bar graph, and a circular chart with 2021 data.
    Add to Wishlist
    Download
    AI Customize
    Infographic chart with a truck carrying five colorful blocks and percentage bars, using green, orange, and brown tones.
    Add to Wishlist
    Download
    AI Customize
    KPI dashboard template with four gauges in blue, green, orange, and red, alongside a flowchart with colored boxes.
    Free
    Add to Wishlist
    Download
    AI Customize
    Bar chart PowerPoint slides showcasing different business categories with colorful bars in different layout designs.
    Free
    Add to Wishlist
    Download
    AI Customize
    Slide featuring a bar graph and line chart showing monthly money transactions, alongside silhouettes of people shaking hands.
    Add to Wishlist
    Download
    AI Customize
    Executive dashboard table featuring numbered rows, with text, and red column headers for clarity.
    Add to Wishlist
    Download
    AI Customize
    Gantt chart slide with monthly columns showing project tasks and subtasks progress using blue shades to indicate status.
    Free
    Add to Wishlist
    Download
    AI Customize
    Gantt chart slide with monthly timeline across three teams, using blue, orange, and green bars to indicate priority items.
    Add to Wishlist
    Download
    AI Customize
    Dashboard showing expense meters, global percentages on a map, and a bar chart visualizing data distribution.
    Add to Wishlist
    Download
    AI Customize
    Slide deck with KPI charts and graphs for business analysis, including financials, HR performance, and customer service.
    Add to Wishlist
    Download
    AI Customize
    KPI dashboard template with a line chart, progress indicators, and bar graphs showing different performance metrics.
    Free
    Add to Wishlist
    Download
    AI Customize
    Project dashboard slide for electricity data with bar graphs showing units and amounts for different categories and months.