Innovative KPI Dashboard PPT And Google Slides Templates

Pack of 56 slides
P.ID : 34543
Advertisement
1.5K+ views
324 Downloads
Get Custom Slides by Experts
Instantly Access Templates in PowerPoint

Editable KPI Dashboard Presentation Slide


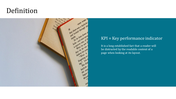
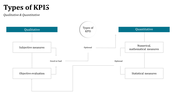
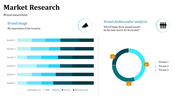
KPI stands for Key Performance Indicator. KPIs are measurable values that are used to evaluate the performance of your business, department, team, or individual against specific goals or objectives. You must be absolutely clear about your business objective before you can develop your plans and course of action.

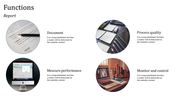
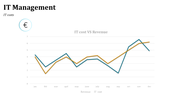
Once you have created them, the first thing you should do is identify the KPIs that will subsequently enable you to assess the success of those actions. This professional KPI deck of 43 slides was made as a resource for you to make it easier for you to explain the findings and display them in a polished manner. The graphs and charts indicating the performance of your company help to evaluate your growth.

Features of this templates


  • 100% customizable slides and easy to download.
  • The slide contains 16:9 and 4:3 formats.
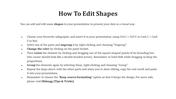
  • Easy to change the colors of the slide quickly.
  • Highly compatible with PowerPoint and Google Slides.

You May Also Like These PowerPoint Templates

Add to Wishlist
Download
AI Customize
Horizontal bar chart with four labeld sections A to D, in purple, pink, teal, and blue, and captions below.
Add to Wishlist
Download
AI Customize
Business chart slide with a red and black line graph on the left, a red bar chart on the right, and two description sections.
Add to Wishlist
Download
AI Customize
Dashboard themed slide with a semi circular gauge showing four icons for speedometers and a central needle pointer.
Add to Wishlist
Download
AI Customize
Business dashboard with expense bar chart, executive distribution, sales pie chart, and revenue gauge.
Free
Add to Wishlist
Download
AI Customize
Purple bar chart PPT slide with years 2018 to 2021 and percentages and a businesswoman presenting the information.
Add to Wishlist
Download
AI Customize
Green speedometer graphics illustrating performance levels at 70, 50, 55, and 85 percent in a PowerPoint template.
Free
Add to Wishlist
Download
AI Customize
Layered area chart with Series 1 in yellow, Series 2 in orange, and Series 3 in black, showing data trends over time.
Add to Wishlist
Download
AI Customize
Clustered bar chart comparing data across quarters with horizontal bars in various colors.
Add to Wishlist
Download
AI Customize
Slide with three vertical boxes in blue, red, and green banners, and rounded icons labeled K, W, and L for learning stages.
Add to Wishlist
Download
AI Customize
Line graph infographic showing data from 2015 to 2020, with three colored lines in purple, yellow, and green, and text.
Add to Wishlist
Download
AI Customize
Donut chart in blue and orange displaying percentage, with matching colored caption boxes on either side.
Add to Wishlist
Download
AI Customize
Our Predesigned Chart Templates PPT Slides Designs
Add to Wishlist
Download
AI Customize
KWL chart slide with three columns in blue, red, and gold, representing learning insights.
Add to Wishlist
Download
AI Customize
Infographic with four bar graphs, each showing data points A to D, and captions areas in green boxes.
Free
Add to Wishlist
Download
AI Customize
PowerPoint presentation slide featuring a stacked bar chart, aerial landscape photo, and a comparison table of drone data.
Free
Add to Wishlist
Download
AI Customize
PowerPoint slide with a circular pie chart showing four segments labeled with percentages and a placeholder text.
Add to Wishlist
Download
AI Customize
Customized Kubler Ross PowerPoint Presentation Template
Add to Wishlist
Download
AI Customize
Visual of boost engagement growth with stacked bar categories: newsletter sign-ups, premium customers, and followers.
Add to Wishlist
Download
AI Customize
Pie charts showing data percentages for growth, with three percentage values with placeholder text.
Add to Wishlist
Download
AI Customize
A medical themed PowerPoint slide with three colorful circular progress bars showing percentages, each with related icons.
Free
Add to Wishlist
Download
AI Customize
Chart infographic with four drop shaped gauge style meters in blue, green, yellow, and red, each with text below.
Add to Wishlist
Download
AI Customize
Dual chart template slide with scatter and bubble charts, the scatter chart on the left and the bubble chart on the right.
Free
Add to Wishlist
Download
AI Customize
Slide with green and white sections, featuring pie and bar charts, and an engine image in the bottom right corner.
Add to Wishlist
Download
AI Customize
Chart with five blue vertical bars showing percentages, paired with captions, on a white background.
Free
Add to Wishlist
Download
AI Customize
Infographic with a circular segmented chart in blue shades, centered around an AI head graphic placed in white background.
Add to Wishlist
Download
AI Customize
PowerPoint pie chart template with three segments and associated icons.
Add to Wishlist
Download
AI Customize
Three vertical rectangular sections with headers in green, blue, and orange, each with captions inside.
Add to Wishlist
Download
AI Customize
Colorful pie chart PowerPoint slide with five labeled sections and captions on a white backdrop.
Free
Add to Wishlist
Download
AI Customize
Pie chart slide with a blue and dark blue donut chart showing 75% sales, two numbered text boxes on the right.
Free
Add to Wishlist
Download
AI Customize
Green and black area chart with a star shaped yellow badge and four circular icons with text below.
Free
Add to Wishlist
Download
AI Customize
Creative infographic with a curved orange graph divided into four steps, each with an icon and label.