Elegant Executive Dashboard PowerPoint Developments

 Canva
Canva

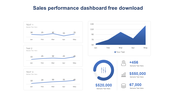
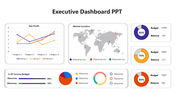
Free executive Dashboard - Metrics Are Important To Your Business KPIs
In Free an executive dashboard PPT, you will see lots of data. Some of it is useful; some are not so much. Just as there are good and bad apples in every basket, there are also good and bad metrics to measure your company's performance in terms of its KPIs. Some of the metrics that should be kept in mind when looking at these KPIs. The first of these metrics that you should keep in mind is the company's value. Value can be seen in two ways: external and internal. In general, the external value comes from marketing, selling, or other external sources. The intrinsic value comes from internal resources. So, if your organization is not maximizing its internal resources, that should be your number one concern, because that means your company is not maximizing the business it is doing. This is why the quality of your metrics is essential. Another indicator for measuring the company's performance is to evaluate its KPIs. You may think that metrics are not the only factors to consider in determining whether a given KPI is valuable or not. However, metrics are essential because they help determine how useful the KPIs are. Metrics that are important in your executive dashboard PPT include sales, revenues, and net income. These are, obviously, quite essential measures. We also have metrics that cover more critical aspects of your business, such as operational efficiencies. They include cost-cutting actions, increasing productivity, reducing defects, streamlining processes, etc. These metrics are also essential indicators in evaluating your company's performance in terms of its KPIs. It can help you monitor the company's progress in terms of its business objectives. In conclusion, while we are on the topic of metrics, it is essential to keep in mind that these should be used in the right way. You should use metrics according to the business goals and objectives that your company has in mind.
In Free an executive dashboard PPT, you will see lots of data. Some of it is useful; some are not so much. Just as there are good and bad apples in every basket, there are also good and bad metrics to measure your company's performance in terms of its KPIs. Some of the metrics that should be kept in mind when looking at these KPIs. The first of these metrics that you should keep in mind is the company's value. Value can be seen in two ways: external and internal. In general, the external value comes from marketing, selling, or other external sources. The intrinsic value comes from internal resources. So, if your organization is not maximizing its internal resources, that should be your number one concern, because that means your company is not maximizing the business it is doing. This is why the quality of your metrics is essential. Another indicator for measuring the company's performance is to evaluate its KPIs. You may think that metrics are not the only factors to consider in determining whether a given KPI is valuable or not. However, metrics are essential because they help determine how useful the KPIs are. Metrics that are important in your executive dashboard PPT include sales, revenues, and net income. These are, obviously, quite essential measures. We also have metrics that cover more critical aspects of your business, such as operational efficiencies. They include cost-cutting actions, increasing productivity, reducing defects, streamlining processes, etc. These metrics are also essential indicators in evaluating your company's performance in terms of its KPIs. It can help you monitor the company's progress in terms of its business objectives. In conclusion, while we are on the topic of metrics, it is essential to keep in mind that these should be used in the right way. You should use metrics according to the business goals and objectives that your company has in mind.


You May Also Like These PowerPoint Templates
Add to Wishlist
Download
AI Customize

Add to Wishlist
Download
AI Customize

Add to Wishlist
Download
AI Customize

Add to Wishlist
Download
AI Customize

Free
Add to Wishlist
Download
AI Customize

Add to Wishlist
Download
AI Customize

Add to Wishlist
Download
AI Customize

Add to Wishlist
Download
AI Customize

Add to Wishlist
Download
AI Customize


Add to Wishlist
Download
AI Customize


Free
Add to Wishlist
Download
AI Customize


Add to Wishlist
Download
AI Customize

Add to Wishlist
Download
AI Customize

Add to Wishlist
Download
AI Customize

Add to Wishlist
Download
AI Customize

Add to Wishlist
Download
AI Customize

Add to Wishlist
Download
AI Customize
