Our Predesigned Dashboard PowerPoint And Google Slides

Dashboard template displaying a sales performance bar chart, two process timing line graphs, and donut charts.
P.ID : 35769
    708 views
    128 Downloads
    Get Custom Slides by Experts
    Instantly Access Templates in PowerPoint

    Dashboard PowerPoint Slide


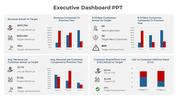
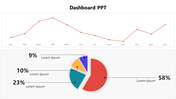
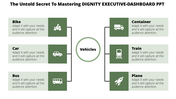
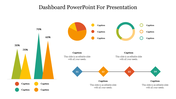
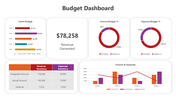
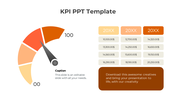
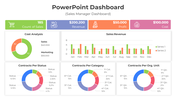
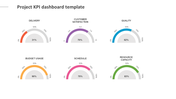
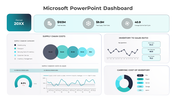
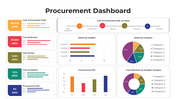
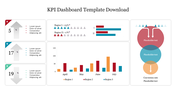
    Unlock the power of data visualization with our Dashboard PowerPoint template. Dashboards are invaluable tools for businesses, offering a consolidated view of key metrics and performance indicators. Our template provides a seamless solution for presenting complex data in a clear, visually engaging format. Whether you're tracking sales, monitoring project progress, or analyzing financial trends, this template empowers you to create informative dashboards that drive informed decision-making. Designed with simplicity and effectiveness in mind, our Dashboard template offers a user-friendly interface and customizable features. With a variety of slide layouts, charts, graphs, and visual elements, you can tailor your dashboard to suit your specific needs and preferences. All slide are fully editable, allowing you to adjust colors, fonts, and content with ease. Ideal for business professionals, project managers, analysts, and anyone tasked with presenting data, our template streamlines the process of creating professional-looking dashboards. By utilizing this template, presenters can save time and effort while delivering impactful presentations that captivate audiences and convey essential insights. Experience the benefits of our Dashboard PowerPoint template firsthand. Enhance your data presentation skills, drive better decision-making, and achieve superior results. Let your data tell a compelling story and elevate your presentations to new heights with our versatile and customizable template.

    Features of this template


    • 100% customizable slides and easy to download.
    • The slide contains 16:9 and 4:3 formats.
    • Easy to change the colors of the slide quickly.
    • Highly compatible with PowerPoint and Google Slides.
    Advertisement

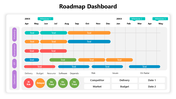
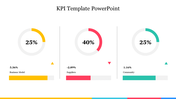
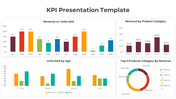
    You May Also Like These PowerPoint Templates

    Add to Wishlist
    Download
    AI Customize
    Circular gauge template with sections in red, orange, yellow, green, and dark green, with captions on either side.
    Add to Wishlist
    Download
    AI Customize
    Infographic dashboard featuring a world map with COVID-19 case data, a gender-based death rate chart, and a pie chart.
    Add to Wishlist
    Download
    AI Customize
    Sashboard design featuring three plant species data and corresponding progress meters in red, green, and blue.
    Add to Wishlist
    Download
    AI Customize
    Chart PPT template showing 4 progress circles with percentages and color coded sections for Blue, Green, Yellow, and Orange.
    Free
    Add to Wishlist
    Download
    AI Customize
    Executive dashboard slide with five numbered circular icons on dark blue shapes, each labeled with key principles.
    Add to Wishlist
    Download
    AI Customize
    Dashboard layout with bar, pie, and stacked charts in yellow, orange, red, and green on a white background.
    Add to Wishlist
    Download
    AI Customize
    Infographic featuring pie graph, horizontal and vertical bar charts for visualizing data trends and comparisons.
    Add to Wishlist
    Download
    AI Customize
    PowerPoint slide for executive dashboard featuring four icons target, speed, error reduction, and growth with text area.
    Add to Wishlist
    Download
    AI Customize
    Executive slide showing expense meters, world sales performance, and bar graphs for margin, expenses, and revenue by month.
    Add to Wishlist
    Download
    AI Customize
    KPI template displaying financial metrics, including sales, profitability, liquidity, and leverage, with two gauge charts.
    Add to Wishlist
    Download
    AI Customize
    Executive dashboard slide with a pie chart, bar graph, area chart, and a profile section for job title and details.
    Add to Wishlist
    Download
    AI Customize
    KPI dashboard template PowerPoint slide featuring three sections for data visualization.
    Add to Wishlist
    Download
    AI Customize
    Dashboard layout including a bar chart of company data, a pie chart for quarterly sales distribution.
    Add to Wishlist
    Download
    AI Customize
    KPI template with three gauges displaying progress levels for sales, production, and downloads.
    Add to Wishlist
    Download
    AI Customize
    Dashboard gauges with red, yellow, green indicators showing low, medium, high performance against a gray background.
    Free
    Add to Wishlist
    Download
    AI Customize
    Pie chart in orange, red, green, and blue sections with two text labels on either side, highlighting sales performance.
    Add to Wishlist
    Download
    AI Customize
    KPI dashboard slide with key metrics for business, development, and downloads, showing percentages with icons.