Budget Dashboard PowerPoint Presentation And Google Slides

 Canva
Canva

Budget Dashboard PPT, Google Slides, and Canva Template
A budget dashboard is a visual tool designed to track, analyze, and manage financial data effectively. It provides a snapshot of key metrics such as income, expenses, savings, and forecasts, enabling users to make informed financial decisions. With its user-friendly layout, a budget dashboard simplifies complex data, offering clear insights into financial performance and helping organizations and individuals maintain financial discipline.
Purpose Of The Slides
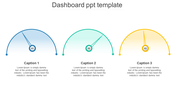
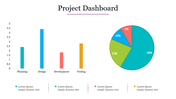
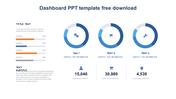
The Budget Dashboard template is a single-slide design that helps users present financial data in a visually compelling and organized way. Featuring a vibrant multicolor theme, this template highlights key financial indicators like revenue, expenses, and variances, all in one place. It’s fully customizable, making it suitable for professionals looking to deliver impactful presentations tailored to their specific financial reporting needs.
Who Can Use It?
- Finance Professionals: Present budgets and financial overviews in meetings and reports.
- Business Leaders: Showcase financial performance and forecasts during strategy sessions.
- Educators and Students: Use it as a teaching or learning tool to explain budgeting concepts.
- Entrepreneurs and Small Business Owners: Track and report financial health to stakeholders or teams.
Special Key Features
Elevate your financial presentations today! Download the Budget Dashboard PowerPoint template to create engaging, easy-to-understand slides that simplify complex data and captivate your audience. Achieve clarity and impact with this professional and customizable slide design!
Features of this template
- 100% customizable slides and easy to download.
- The slides contain 16:9 and 4:3 formats.
- Easy to change the colors quickly.
- Highly compatible with PowerPoint, Google Slides, and Canva Presentation.


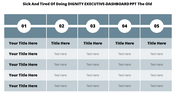
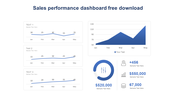
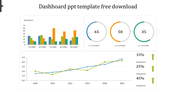
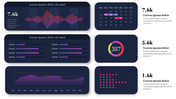
You May Also Like These PowerPoint Templates


Free
Add to Wishlist
Download
Edit

Add to Wishlist
Download
Edit

Add to Wishlist
Download
Edit

Add to Wishlist
Download
Edit

Add to Wishlist
Download
Edit

Add to Wishlist
Download
Edit

Add to Wishlist
Download
Edit

Add to Wishlist
Download
Edit


Add to Wishlist
Download


Add to Wishlist
Download
Edit

Add to Wishlist
Download
Edit

Add to Wishlist
Download
Edit


