Editable Energy Dashboard PPT And Google Slides Themes

Pack of 11 slides
P.ID : 72494
Advertisement
748 views
137 Downloads
Get Custom Slides by Experts
Instantly Access Templates in PowerPoint

Energy Dashboard Presentation Slides


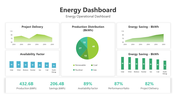
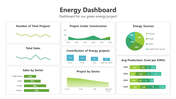
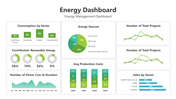
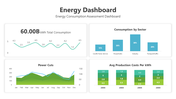
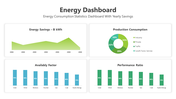
Unlock the power of data visualization with our energy dashboard PPT and Google Slides template, tailored for energy professionals, analysts, and educators. This versatile template is an indispensable tool for presenting and analyzing energy data, offering a comprehensive view of energy consumption, production, and efficiency metrics. Perfect for meetings, reports, and educational purposes, it transforms complex energy data into clear and engaging presentations.

Featuring visually appealing charts, graphs, and infographics, our template simplifies the tracking and presentation of key performance indicators. It covers various aspects of energy management, including renewable energy sources, energy efficiency, and consumption trends. Each slide is meticulously designed to provide insightful analysis and support data-driven decision-making.

The template is fully editable and customizable, allowing you to tailor every element to suit your specific needs and audience. Its professional design focuses on clarity and functionality, ensuring that your data is presented in a visually engaging and easily understandable manner. Elevate your energy management presentations with our expertly designed energy dashboard PPT and Google Slides template. Whether you aim to inform, educate, or inspire action, this template is your ultimate resource for effective energy data presentation. Download this presentation today and take your energy analytics to the next level!

Features of this templates


  • 100% customizable slides and easy to download.
  • The slide contains 16:9 and 4:3 formats.
  • Easy to change the colors of the slide quickly.
  • Highly compatible with PowerPoint and Google Slides.

You May Also Like These PowerPoint Templates

Add to Wishlist
Download
AI Customize
Semi circular gauge in shades of brown and peach with a pointer, alongside text and a silhouette group at the bottom.
Free
Add to Wishlist
Download
AI Customize
An executive dashboard showing income and expense distribution, with key financial metrics and a line graph.
Add to Wishlist
Download
AI Customize
Semi circular gauge with six color coded sections from green to red, With numbers 01 to 06, labeled KPI at the bottom.
Add to Wishlist
Download
AI Customize
A collection of isometric KPI infographic slides showcasing bar graphs, pie charts, and performance metrics with icons.
Add to Wishlist
Download
AI Customize
Slide with blue stats on the left and various charts, including bar and pie charts in different colors.
Add to Wishlist
Download
AI Customize
Comprehensive project dashboard template with progress charts, data bars, and financial performance indicators.
Add to Wishlist
Download
AI Customize
KPI dashboard featuring financial data with profit trends and metrics visualized through charts and dials.
Free
Add to Wishlist
Download
AI Customize
Dashboard template with five numbered columns and placeholders text areas in different shades of grey theme.
Add to Wishlist
Download
AI Customize
KPI Dashboard slide displaying metrics with bar charts and line graphs for key business indicators.
Add to Wishlist
Download
AI Customize
PowerPoint speedometer template featuring three speed gauges.
Add to Wishlist
Download
AI Customize
Circular tachometer divided into four sections  in blue, red, purple, and teal, featuring transport icons and captions.
Add to Wishlist
Download
AI Customize
Dashboard PowerPoint template featuring three speedometer graphics labeled with captions.
Add to Wishlist
Download
AI Customize
Attractive Tachometer Presentation Template Designs
Add to Wishlist
Download
AI Customize
Attractive Tachometer PowerPoint Presentation Template
Add to Wishlist
Download
AI Customize
PowerPoint dashboard template displaying Employee Net Promoter Score with a gauge and two emojis.
Add to Wishlist
Download
AI Customize
Vector illustration of a speedometer with colored section on a conveyor belt with placeholder text.
Add to Wishlist
Download
AI Customize
Dashboard PPT slide with three colorful speedometers representing varying performance levels on a black background.
Add to Wishlist
Download
AI Customize
Three circular tachometer dials in blue, pink, and red, each displaying different percentage values with captions below.
Add to Wishlist
Download
AI Customize
Slide with two speedometer style gauge charts in green, red, and purple segments, displaying percentages.
Add to Wishlist
Download
AI Customize
Dashboard template with a world map showing highlighted regions, bar graphs, and financial data captions.
Add to Wishlist
Download
AI Customize
Three colored tachometer gauges in red, orange, and green, each paired with a caption areas beneath.
Add to Wishlist
Download
AI Customize
Executive dashboard slide displaying project details including start date, deadline, team members, and activities.
Add to Wishlist
Download
AI Customize
Yellow speedometer design with two semicircular gauges displaying percentages, each paired with captions.
Add to Wishlist
Download
AI Customize
Green themed dashboard template with three plant growth in line, bar and area chart for different years and species.
Add to Wishlist
Download
AI Customize
Tachometer PowerPoint template with four stages featuring colorful gauges and caption areas on a white backdrop.
Add to Wishlist
Download
AI Customize
Dashboard template with two horizontal bar charts, a calendar icon, and circular progress indicators in orange and green.
Add to Wishlist
Download
AI Customize
Dashboard slide showcasing a semi circular layout with five numbered segments in blue, red, and green, each with captions.