Free - Executive Dashboard PPT Presentation And Google Slides

Free
Dashboard with four sections showing charts, icons, and metrics in purple, red, green, and teal.
P.ID : 4003
    3.3K+ views
    1.3K+ Downloads
    Get Custom Slides by Experts
    Instantly Access Templates in PowerPoint

    Executive Dashboard Presentation Slide


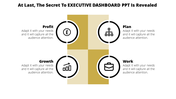
    An Executive Dashboard, a vital tool for top-level management, condenses essential data and key performance indicators into a concise, visually engaging format. It provides executives with immediate access to critical insights, enabling data-driven decision-making. Our dashboard PowerPoint offers an ideal solution for professionals seeking to communicate complex information with ease. With fully editable slides, it ensures adaptability to specific organizational needs and preferences. This template empowers presenters to streamline their presentations, saving time, and fostering a deeper understanding of the data among the audience. Use it to simplify complex information, facilitate informed decision-making, and drive your organization's strategic direction effectively.


    Features of the template:


    • 100% customizable slides and easy to download.
    • Slide are available in different nodes & colors.
    • The slide contains 16:9 and 4:3 formats.
    • Easy to change the colors of the slide quickly.
    • Highly compatible with PowerPoint and Google Slides.
    • Well-crafted template with an instant download facility.
    Advertisement

    You May Also Like These PowerPoint Templates

    Add to Wishlist
    Download
    AI Customize
    PowerPoint chart template displaying three donut charts with percentages and icons representing data categories.
    Add to Wishlist
    Download
    AI Customize
    Bar chart presentation showing data from 2017 to 2020, with values 2.4, 4.4, 1.8, and 2.8, respectively.
    Free
    Add to Wishlist
    Download
    AI Customize
    Horizontal timeline graphic with five purple arrows, labeled captions and date ranges, aligned with a month indicator.
    Add to Wishlist
    Download
    AI Customize
    3D pie chart with four color-coded segments red, orange, yellow, and brown displaying percentage values.
    Free
    Add to Wishlist
    Download
    AI Customize
    Bar chart slide with three stacked bars, each divided into segments with percentage labels, and a table on the right.
    Add to Wishlist
    Download
    AI Customize
    Timeline charts slides showcasing different stages and tasks across various projects, with color coded bars for each task.
    Free
    Add to Wishlist
    Download
    AI Customize
    Slide with four green donut charts and two horizontal bar graphs showing data comparisons across quarters and months.
    Free
    Add to Wishlist
    Download
    AI Customize
    Illustration of six red bars with corresponding percentages and a businesswoman standing beside them.
    Free
    Add to Wishlist
    Download
    AI Customize
    Business strategy chart with blue headers for months, showing green bars representing schedules.
    Add to Wishlist
    Download
    AI Customize
    Stacked bar chart with four vertical bars showing percentages from 2013, 2014, and 2015 in varying green shades.
    Free
    Add to Wishlist
    Download
    AI Customize
    Business plan slide showing bar chart comparing impact of society, customer satisfaction, and people satisfaction.
    Add to Wishlist
    Download
    AI Customize
    Template showcasing various chart designs, including line, bar, pie, and comparison charts across multiple slides.
    Add to Wishlist
    Download
    AI Customize
    Creative charts showing a circular 60% approval metric, bar graphs, and a 55% Twitter engagement donut chart.
    Free
    Add to Wishlist
    Download
    AI Customize
    Bar chart comparing metrics over years alongside a diagram linking manager, idea, and management to business growth.
    Add to Wishlist
    Download
    AI Customize
    Funnel infographic with blue, red, yellow, and green sections, each with icons, connected to text descriptions.
    Free
    Add to Wishlist
    Download
    AI Customize
    Four vertical orange columns and percentages, labeled by year, along with a businesswoman illustration on the right.
    Free
    Add to Wishlist
    Download
    AI Customize
    Annual report slide with orange bar graphs showing percentage growth from 2014 to 2021, paired with captions on the left.
    Add to Wishlist
    Download
    AI Customize
    Infographic chart with a truck carrying five colorful blocks and percentage bars, using green, orange, and brown tones.
    Free
    Add to Wishlist
    Download
    AI Customize
    Vertical bars in purple, blue, green, yellow, orange, and pink showing percentages, next to a businesswoman.