4 Noded KPI Dashboard PowerPoint Template and Google Slides

Performance dashboard with semi-circular gauges indicating 35%, 50%, 60%, and 90% completion.
P.ID : 1808
    4.9K+ views
    492 Downloads
    Get Custom Slides by Experts
    Instantly Access Templates in PowerPoint

    KPI Dashboard PowerPoint Template and Google Slides Themes


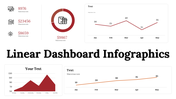
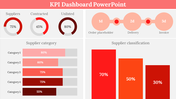
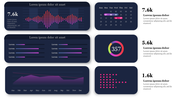
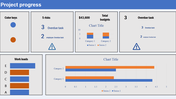
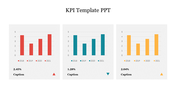
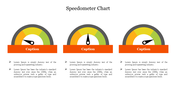
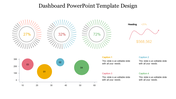
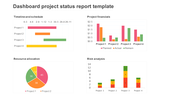
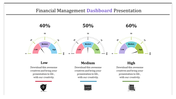
    Release the power of your data with our KPI Dashboard PowerPoint Template and Google Slides Themes. Crafted with four dynamic nodes, each featuring captions, title holders, and spacious text areas, this template transforms complex metrics into clear, compelling visuals. 

    Perfect for project managers, business analysts, and executives, this user-friendly tool enhances your ability to communicate KPIs effectively. Leave outdated methods behind and embrace this innovative solution, whether you're presenting quarterly results, analyzing sales trends, or evaluating marketing campaigns. 

    Improve your data storytelling and lead with confidence—download our KPI Dashboard today to revolutionize your presentations.

    Features of the Template

    • 100 % customizable slides.
    • The slide show is in 4:3, 16:9, zip format.
    • There is powerful connectivity with Google Slides and PowerPoint.
    • It is simple and quick to alter the slide's color.
    • An efficient template that can be easily accessed immediately.
    • Well-crafted template with an instant download facility.
    Advertisement

    You May Also Like These PowerPoint Templates

    Add to Wishlist
    Download
    AI Customize
    Three speedometers showing progress percentages: 25%, 50%, and 75%, with gradient colors in yellow, orange, and red.
    Free
    Add to Wishlist
    Download
    AI Customize
    Slide with three gauge meters in orange, yellow, and gray, each paired with a table for KPI metrics.
    Free
    Add to Wishlist
    Download
    AI Customize
    KPI presentation template displaying colorful charts for revenue, units sold, and product category analysis.
    Free
    Add to Wishlist
    Download
    AI Customize
    Effective Project Dashboard PowerPoint Presentation
    Free
    Add to Wishlist
    Download
    AI Customize
    Project management dashboard slide showing various tasks in planning, design with workload, and budget charts.
    Add to Wishlist
    Download
    AI Customize
    Speedometer clipart slide featuring three gauges at 25%, 50%, and 75% with space for descriptive text below each.
    Free
    Add to Wishlist
    Download
    AI Customize
    KPI slide displaying key performance indicators with many sections and accompanying data charts.
    Add to Wishlist
    Download
    AI Customize
    Dashboard slide showcasing project management KPIs with bar graphs, a line graph, and a pie chart in different colors.
    Add to Wishlist
    Download
    AI Customize
    Project management dashboard with charts for budget, progress, risks, workload, and projected launch date and icons.
    Add to Wishlist
    Download
    AI Customize
    PowerPoint slide with KPI dashboard metrics, including revenue, sales by month, and customer revenue comparison.
    Free
    Add to Wishlist
    Download
    AI Customize
    KPI Dashboard with bubbles for sales, attendance, download, and report and a client location legend.
    Add to Wishlist
    Download
    AI Customize
    KPI Training slide featuring a social media analysis table with metrics for followers, mentions, interactions, and shares.
    Add to Wishlist
    Download
    AI Customize
    Task management dashboard slide showing task numbers and completion percentages with colored gauge icons.
    Add to Wishlist
    Download
    AI Customize
    Revenue dashboard with bar charts, statistics, and sliders showing data metrics in various colors.
    Add to Wishlist
    Download
    AI Customize
    Editable Speedometer PowerPoint Template Presentation
    Add to Wishlist
    Download
    AI Customize
    Slide featuring a colorful tachometer diagram explaining its components, functionality, and usage with icons.
    Add to Wishlist
    Download
    AI Customize
    RAG dashboard with red, yellow, and green sections showing project status, using bar, line, and pie charts.