Free - KPI Presentation PowerPoint for Template Google Slides

Free
KPI slide displaying three circular meters with red, green, and orange sections, with text descriptions on the right.
P.ID : 1823
    3.7K+ views
    1K+ Downloads
    Get Custom Slides by Experts
    Instantly Access Templates in PowerPoint

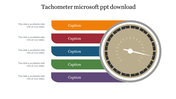
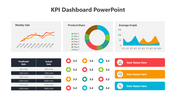
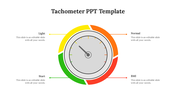
    Practical PowerPoint PPT template For KPI Presentation


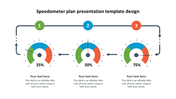
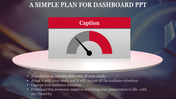
    Get our KPI Presentation PowerPoint to illustrate a quantifiable performance measure over time for a specific plan. This template will assist you in analyzing the current performance of your business. This template is mainly used in a business meeting or company meeting. This KPI Presentation PowerPoint has three-meter designs that help to represent three performances. In addition, this template has three captions to add your information. It is a pre-built slide with all the essential elements. Users can edit the icon colors and text in this template. We also have a collection of KPI PPT slides.

    Features of this template

    • This template is 100% editable(shape color, size & text)
    • This template has a dashboard theme.
    • Drag and drop image placeholder
    • Huge Collections of slides to impress y.our audience
    • It supports an aspect ratio of 4:3
    • Easily readable and acceptable template.
    Advertisement

    You May Also Like These PowerPoint Templates

    Add to Wishlist
    Download
    AI Customize
    Project dashboard slides with Gantt chart, a burndown chart, and a timeline, using a palette of brown, green, and red.
    Add to Wishlist
    Download
    AI Customize
    Tachometer PowerPoint slide with gauges indicating 10, 20, and 30 with captions for each.
    Add to Wishlist
    Download
    AI Customize
    Concentric pentagons in black with text areas around each corner, forming a simple monochrome layout.
    Add to Wishlist
    Download
    AI Customize
    Horizontal infographic with four tachometer icons in gradient colors, labeled with captions for each gauge.
    Add to Wishlist
    Download
    AI Customize
    Slide featuring a tachometer dial with four performance levels and linked captions in red, yellow, maroon, and blue.
    Add to Wishlist
    Download
    AI Customize
    Dashboard layout with charts in orange tones, including a donut chart, bar graphs, and a line chart for monthly data.
    Add to Wishlist
    Download
    AI Customize
    Slide with four red speedometers, each indicating a different percentage level, against a white background.
    Add to Wishlist
    Download
    AI Customize
    Blue themed dashboard layout with a line chart, two growth metrics, and three semi circle gauges for budget.
    Free
    Add to Wishlist
    Download
    AI Customize
    Circular speedometer with orange and gray segments, displaying kilometer markings from 5.5 KM to 8 KM.
    Free
    Add to Wishlist
    Download
    AI Customize
    Dashboard graphic featuring a circular speedometer with a red needle, surrounded by text labels for various business metrics.
    Add to Wishlist
    Download
    AI Customize
    Speedometer slide with three colorful gauges showing percentages each with captions.
    Add to Wishlist
    Download
    AI Customize
    Dashboard with a red line graph for Jan-May and a bar chart of four colored percentage bars and category icons.
    Free
    Add to Wishlist
    Download
    AI Customize
    Dashboard with line chart for appointments, bar chart from hospital earnings to patient totals, and intake by category.
    Add to Wishlist
    Download
    AI Customize
    Slide deck of energy dashboards displaying data visualizations like pie charts, bar and line graphs, in green shades.