Innovative KPI PowerPoint And Google Slides Template

KPI dashboard with a dual-line graph, balance performance gauge, and quarterly income metrics.
P.ID : 1839
    2K+ views
    259 Downloads
    Get Custom Slides by Experts
    Instantly Access Templates in PowerPoint

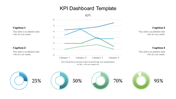
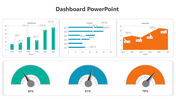
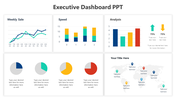
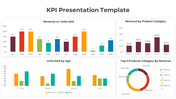
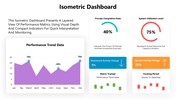
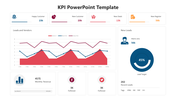
    Creative KPI PowerPoint Template


    Effectively track and communicate your key performance indicators (KPIs) with our comprehensive KPI PowerPoint template. Designed for business leaders, managers, and analysts, this template provides a robust framework for presenting crucial performance metrics across various business functions. With customizable slides tailored to different KPIs such as sales, marketing, finance, and operations, this template enables you to visualize your data clearly and impactfully. Its user-friendly layout and professional design make it easy to highlight trends, measure progress, and identify areas for improvement.

    Whether you're conducting a quarterly review, presenting to stakeholders, or managing day-to-day performance, this template ensures your KPIs are presented in a manner that drives informed decision-making and strategic planning. Elevate your performance tracking and reporting with our versatile KPI PowerPoint template. Download today and take your presentations to the next level!

    Features of this template


    • 100% customizable slides and easy to download.
    • The slide contains 16:9 and 4:3 formats.
    • Easy to change the colors of the slide quickly.
    • Highly compatible with PowerPoint, Google Slides and Canva templates.
    Advertisement

    You May Also Like These PowerPoint Templates

    Add to Wishlist
    Download
    AI Customize
    Use Dashboard PPT Template Slide Designs
    Free
    Add to Wishlist
    Download
    AI Customize
    Dashboard template with three colorful gauge icons in the center and text boxes in green, blue, and gold.
    Free
    Add to Wishlist
    Download
    AI Customize
    PowerPoint slide with a project dashboard showing two speedometers to represent project progress with captions.
    Add to Wishlist
    Download
    AI Customize
    KPI dashboard with bar graphs showing data trends over time and two green summary boxes.
    Free
    Add to Wishlist
    Download
    AI Customize
    Dashboard PPT template featuring a speedometer with labeled sections like Direction, Objectives, Data, Business, and Study.
    Add to Wishlist
    Download
    AI Customize
    Vehicle dashboard slide featuring a speedometer on the left and a detailed table on the right with its brands.
    Add to Wishlist
    Download
    AI Customize
    KPI template showing a bar chart with four cases, and two circular progress indicators in blue and orange showing percentage.
    Add to Wishlist
    Download
    AI Customize
    A slide displaying dashboard elements like bar graphs, a world map with data points, and progress bars, with captions.
    Add to Wishlist
    Download
    AI Customize
    Marketing KPI dashboard comparing Google, Facebook, and Bing ads, featuring clicks, cost, line charts, and campaign analysis.
    Add to Wishlist
    Download
    AI Customize
    Slide with multiple charts including bar, line, and pie charts illustrating data for hires, turnover, and training.
    Add to Wishlist
    Download
    AI Customize
    Orange speedometer slide with a gauge showing 70% progress and space for caption text below.
    Free
    Add to Wishlist
    Download
    AI Customize
    Visual of project phases and value generation over time, with milestones labeled as planning, detailing, and implementation.
    Free
    Add to Wishlist
    Download
    AI Customize
    Tachometer PowerPoint slide featuring a colorful gauge with segments labeled with space for captions on a white backdrop.
    Add to Wishlist
    Download
    AI Customize
    Business slide with four sections representing different concepts Equality, Human Rights, Independent, and Multi Party.
    Add to Wishlist
    Download
    AI Customize
    Executive dashboard with a pie chart, vertical and horizontal bar graph, and a waterfall chart, displaying various data.