Free - Creative Free KPI PowerPoint Presentation And Google Slides
Free

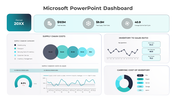
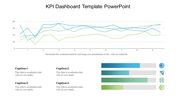
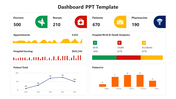
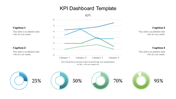
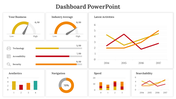
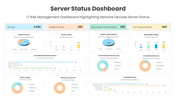
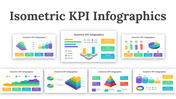
Creative KPI PowerPoint Slide
In the world of business and management, Key Performance Indicators (KPIs) serve as vital metrics used to evaluate the success of an organization in achieving its objectives. These measurable indicators help businesses track progress, identify areas for improvement, and make informed decisions to drive performance. Whether it's monitoring sales targets, assessing customer satisfaction, or measuring operational efficiency, KPIs provide valuable insights into the health and performance of various aspects of a business. Our KPI PowerPoint template is a versatile tool designed to assist professionals in effectively presenting key performance indicators to stakeholders, team members, and decision-makers. With visually appealing graphics, charts, and diagrams, the template enables users to showcase KPI data in a clear and understandable manner. From quarterly sales reports to project progress updates, users can customize the template to create impactful presentations tailored to their specific needs. This template is ideal for business professionals, managers, executives, and analysts who need to communicate KPIs effectively to diverse audiences. By utilizing the editable slides, presenters can easily customize content, add relevant data, and highlight key insights to facilitate better decision-making. With its user-friendly design and fully editable features, this template streamlines the process of creating informative and visually engaging KPI presentations. Invest in this template today and elevate your ability to communicate performance metrics with clarity and precision.
Features of this template
- 100% customizable slides and easy to download.
- The slide contains 16:9 and 4:3 formats.
- Easy to change the colors of the slide quickly.
- Highly compatible with PowerPoint and Google Slides.


You May Also Like These PowerPoint Templates
Add to Wishlist
Download
Edit


Add to Wishlist
Download
Edit


Add to Wishlist
Download

Add to Wishlist
Download
Edit


Add to Wishlist
Download
Edit

Add to Wishlist
Download
Edit

Add to Wishlist
Download
Edit

Add to Wishlist
Download
Edit

Free
Add to Wishlist
Download
Edit


Add to Wishlist
Download
Edit

Add to Wishlist
Download
Edit

Add to Wishlist
Download
Edit


Showing20 of69,218 templates