Mind Blowing Dashboard PowerPoint And Google Slides Template

Hospital dashboard like staff numbers, appointments, earnings, birth and death analytics, and patient trends.
P.ID : 13484
    1K+ views
    165 Downloads
    Get Custom Slides by Experts
    Instantly Access Templates in PowerPoint

    Amazing Dashboard PowerPoint Template


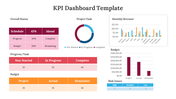
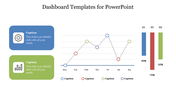
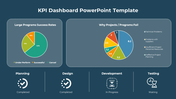
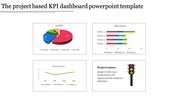
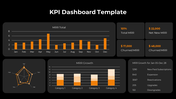
    A dashboard is a visual representation of data, typically presented in charts, graphs, and metrics, that enables users to monitor and analyze key performance indicators (KPIs) or metrics at a glance. It facilitates a centralized view of information, progress monitoring, trend identification and data-driven decision-making in various industries such as business, finance, marketing and project management. By condensing complex data into digestible visual formats, dashboards improve transparency, accountability and productivity within organizations, empowering users to make timely decisions and drive performance improvements. This template provides professionals in business, finance, marketing, project management, and other fields with customizable designs, layouts, and data visualization options to create informative and visually appealing dashboards. With fully editable slides, users can tailor the template to their specific needs, streamline reporting processes, monitor KPIs and effectively communicate insights to stakeholders, ultimately saving time and driving informed decision-making and performance improvements.


    Features of this template


    • 100% customizable slides and easy to download.
    • The slide contains 16:9 and 4:3 formats.
    • Easy to change the colors of the slide quickly.
    • Highly compatible with PowerPoint and Google Slides.
    • Well-crafted template with an instant download facility.
    • Quick and easy edit features. 

    Advertisement

    You May Also Like These PowerPoint Templates

    Add to Wishlist
    Download
    AI Customize
    Colorful circular diagram slide illustrating four corporate strategy methods with labels and percentages.
    Add to Wishlist
    Download
    AI Customize
    KWL chart with sections  in blue, green, and red, each column containing placeholder text.
    Add to Wishlist
    Download
    AI Customize
    Vertical bar chart in red shades, displaying yearly data from 2017 to 2020, with detailed labels on the right.
    Add to Wishlist
    Download
    AI Customize
    Dark themed layout featuring four pie charts with shaded segments, each displaying different percentages.
    Add to Wishlist
    Download
    AI Customize
    Green shaded bar chart displaying data from 2016 to 2021, with three numbered captions below.
    Add to Wishlist
    Download
    AI Customize
    Chart slide showing market supply data from 2004 to 2014 with red bars and percentage annotations.
    Add to Wishlist
    Download
    AI Customize
    Dashboard with four bar charts in yellow, green, teal, and red, comparing project risks and change requests.
    Add to Wishlist
    Download
    AI Customize
    Project Gantt chart with task descriptions, percentage completion, and horizontal progress bars.
    Add to Wishlist
    Download
    AI Customize
    Slide with pie charts, line graphs, and a bar chart in shades of green, illustrating data trends and comparisons.
    Add to Wishlist
    Download
    AI Customize
    Six month Gantt chart with bars in blue, green, red, orange, and teal, arranged for task tracking.
    Free
    Add to Wishlist
    Download
    AI Customize
    Infographic of a bar chart representing yearly growth from 2018 to 2021 with a businesswoman illustration.
    Add to Wishlist
    Download
    AI Customize
    Circular pie chart divided into five colored sections noted with percentages, with corresponding boxes for text area.
    Free
    Add to Wishlist
    Download
    AI Customize
    Five step process chart with titled segments in shades of purple, showing stages and supporting information.
    Add to Wishlist
    Download
    AI Customize
    Innovative KWL Chart PowerPoint Presentation Slide
    Add to Wishlist
    Download
    AI Customize
    Analysis report template featuring a purple and green area graph comparing five projects, with separate information
    Add to Wishlist
    Download
    AI Customize
    Area chart with overlapping blue, teal, and green sections, timeline on the axis, and three labeled boxes below.
    Add to Wishlist
    Download
    AI Customize
    A PowerPoint template displaying growth with stages represented by numbered circles showing data for different stages.
    Add to Wishlist
    Download
    AI Customize
    Color coded KWL chart template with sections for What I Know, What I Want to Know, and What I Learned with placeholder text.
    Add to Wishlist
    Download
    AI Customize
    Pie chart slide showcasing six labeled segments in yellow and gray with surrounding icons, on a blue networked background.